How cool is that.
How cool is that.
Very cool. What are the odds of that I wonder.
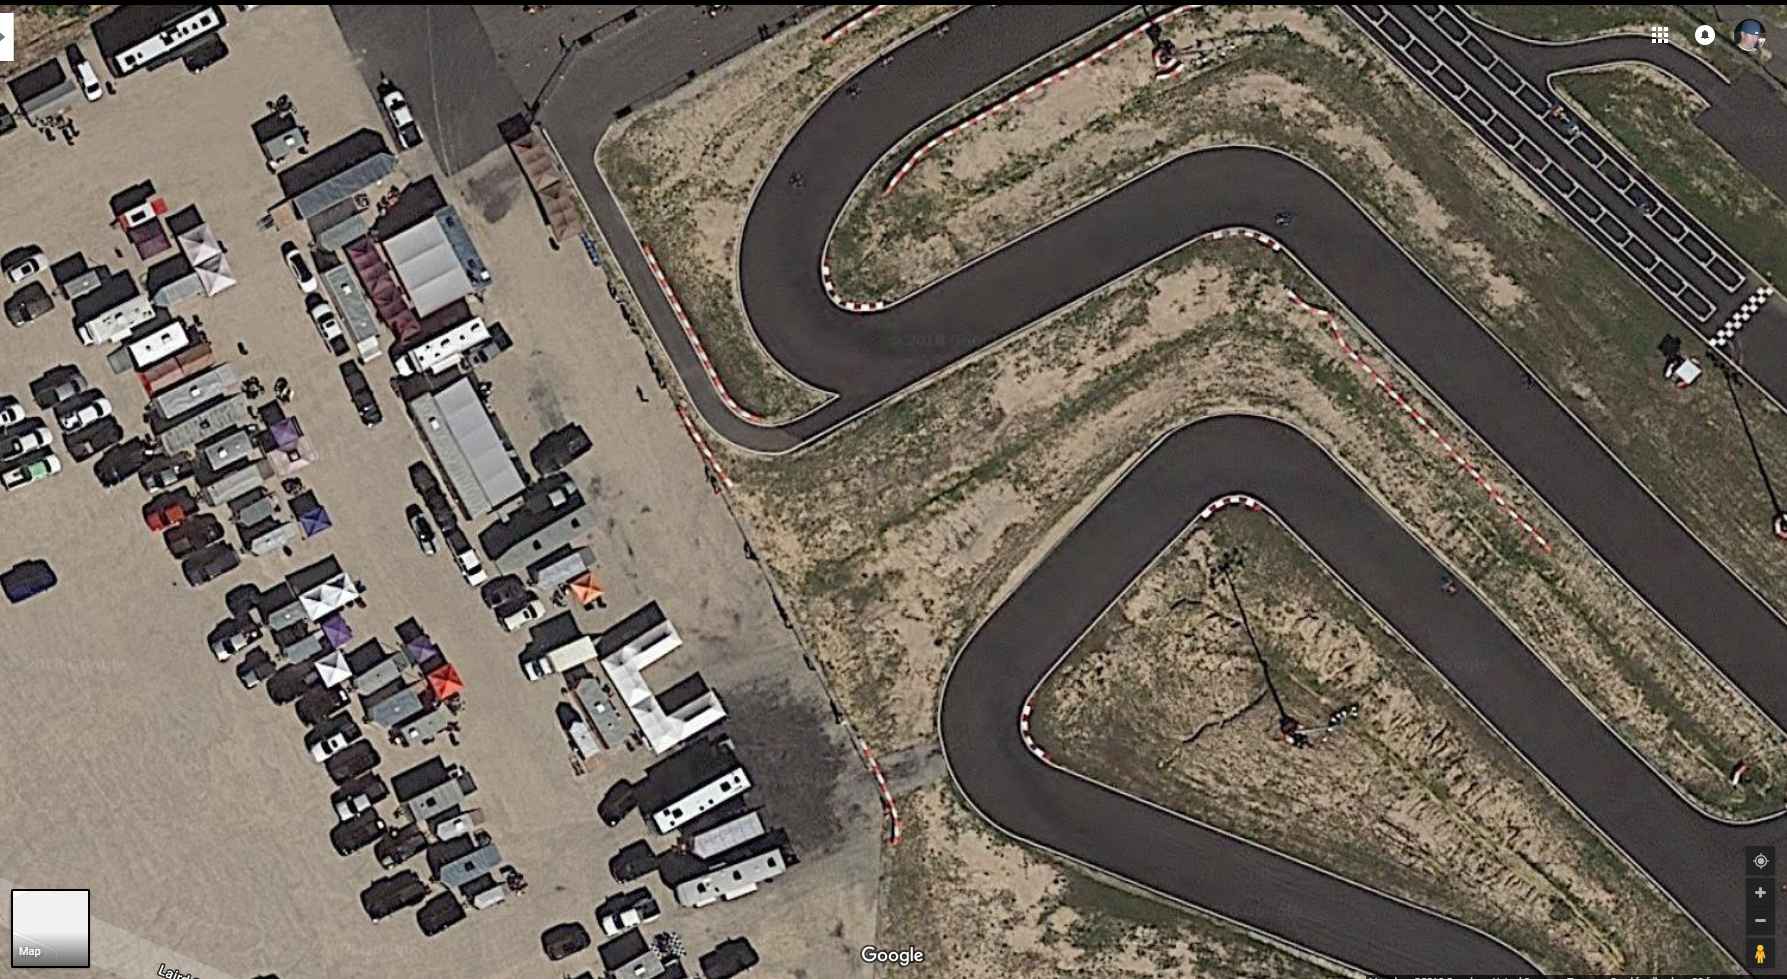
Speedsportz Racing Park in New Caney, TX also shows a kart race going on in it’s satellite view. The cool thing about it, I was at the track for a race when it was taken, and by counting the karts (dots) on the track, it was during the session that my daughter was running in.
What date was the race?
I’m going on a mission to find out the odds of this haha.
Sept 2017 some time. I know because of which karts we have in the pits.
how long did the race go for?
Saturday and Sunday: 8-5ish , if you are near by you should come out this weekend and check it out. Lost of folks camp at the track
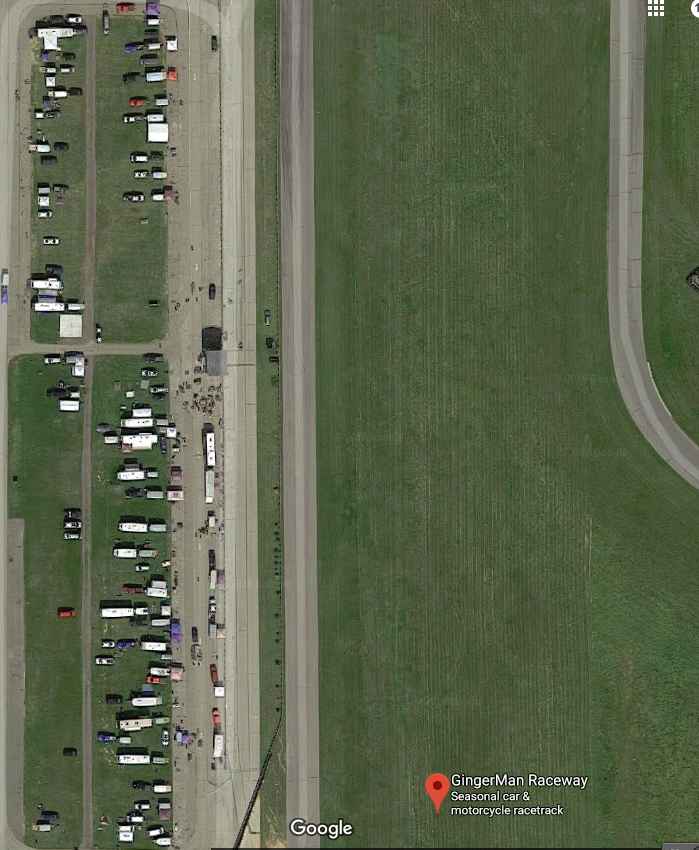
'Well first of all I needed to find the current satellite in use by Google to figure out its orbit and schedule. The LandSat 8 Is the current satellite in use, it images the entire Earth every 16 days. Every day it takes up to 700 scenes this means it takes a total of 11200 scenes to map the Earth. Now assuming each scene is equal, we can find out the size by dividing the Earths surface area (510,100,000 Squared Kilometers) with the amount of total scenes. Now the LandSat 8 takes about 98.8 minutes to complete one orbit of the earth. This means about 14.5748979 (14.60 for simplicity) orbits a day. This means it completes 47.9 scenes every orbit (700 divided by 15.6). A normal day is 1440 minutes, the race day lasts for 9 hours or 540 minutes, this means the race day is 3 eighths of the day. The specific area we are looking for GingerMan - would fit into one scene ( a scene is 45544.6km²), which would mean it was 1 out of 700, but the track day only lasts for 9 hours or 540 minutes, this divided by the time it takes the Landsat 8 to orbit (98.8 minutes) this means the Landsat 8 gets 5.46 or 5.5 orbits to photograph the race. I already worked out that each orbit allowed for 47.9 potential scenes every orbit. 5.5 x 47.9 means the LandSat 8 would have 263.45 out of 700 possible scenes where it could capture the GingerMan race on the date of the race. That means a 38% chance on the day that the race occurred.
However all the images are photographed over a period of 16 days which means, we have to find how many days into the 16 day period was the LandSat 8, on the 2nd of September 2017(I’m assuming it is the first Saturday of the month I might be wrong). From the LandSat 8’s launch on the 30th of May 2013, to September 2nd of 2017 1557 days had elapsed, which means the satellite was 5 days into its photographing period. This means 5 days of 700 potential scenes each. This equates to 3500 scenes, of which 263.45 the GingerMan’s race could’ve been photographed. That means a 7.5% chance of the race being photographed.
I am no mathematician but I have given this a good go. I don’t know how accurate this would be as the method of satellite photography might not mean that a scene = 1 image or one land mass, I’m not an instrumentation expert either haha. But the math here should be correct I used a calculator here and converted all necessary measurements so there shouldn’t be any discrepancies. Feel free to double check.
@Bimodal_Rocket
TL:DR
The probability of the google satellite view of Gingerman photo showing the kart race was 7.5%!!! Very tiny and lucky!
@spribyl
I appreciate the offer man but I am definitely not near by haha, I am from the land down under. Do you or anyone do any coverage of the race though? I’d be happy to watch.
Ok.next time I’ll be careful what I ask for! Good job figuring it out!
Haha thanks and all good. It was kind of exciting.