In a perfect world, I’d expect the GPS_LaAcc trace would be a smooth line through a tight corner on a sprint track. It would look similar to a sine wave. But back to reality, it this obtainable or desirable? I’ve seen the AiM video on the GPS_LaAcc and how even slight steering wheel movement down the straight will kills off speed. With short straights and many turns, the biggest gains should be in corner exits.
In my opinion, you’re going to see more gains in corner exits in general, because that’s where the power application phase is happening.
I’d agree with you that if the LatAcc curve is smooth, is shows that the kart has good loading going into the corner, but I’d also look at what the peak G is as well, across several laps. You can have a smooth LatAcc, but we well under peak G, which means that you’re leaving cornering performance on the table.
If it’s a large variation over a single session, assuming that the kart is mechanically ok, then the driver is doing something different over the course of a run.
The person would would be really good to talk about this is @Eric_Gunderson1, though. #mrreportingguy
The reason I posed the question is after studying our past season, many of our GPS_LaAcc corner traces are more saw tooth than smooth. First though was that it was amazing that the GPS sensor even can detect small wheel movements. We knew that we were not always one with the kart and the trace would seem to confirm that.
Totally agreed. I always look at Speed and and Lateral G curve smoothness to see how well balance I am with my kart.
@Tony_Z @DavinRS from what I’ve seen there is a fair bit of ‘noise’ in the lateral G trace, even at the smoothest of tracks with the smoothest of drivers. This is likely much more dramatic in a kart due to where the logger is placed (on a steering wheel), and also because of how responsive a kart chassis is to the track compared to a suspended car.
With that said, I do like to see a smooth rise and smooth fall as the lateral g picks up and falls throughout a corner. If you are seeing a ‘sawtooth’ sort of look, where the trace has peaks and valleys throughout the corner, that is a good sign of either a really rough track, or a really rough driver. A good sign of when a corner is being taken at least somewhat correctly is when you see the lateral G trace plateau pretty smoothly at or near the apex, then fall rather rapidly out of the corner.
Personally, I like to look at where the lateral g traces of multiple laps ‘pick up’ compared to each other headed into a particular corner. This tells me where the driver began to really turn into the corner, which typically is an area I like to look at, as this is usually where driving or handling issues begin.
2 Likes
That is a sign of his really rough driver.
2 Likes
Peak G is good with the proviso that its sustained. A massive peak g on a saw tooth style g trace through a corner doesn’t mean you are reaching the true potential of the chassis-tire combination. It could well be sliding and gripping or hopping.
Everything needs to be looked at together.
1 Like
Eric, forum:
Where should the lateral peak occur relative to the apex? And why?
How should the trace look in theory? I’d have thought a pyramid in profile with the apex truncated. (Ie. a perfect driver in perfect conditions would be able to hold the karts’ peak value for a period of time, even as lock and throttle are being gradually applied and unapplied throughout the turn no?)
Thanks for your thoughts.
Lee
Lee,
Great question! I think this is one that took me a while to consider, and answer.
I should preface my answer by saying that even in a vehicle as simple as a kart, different driving styles will dramatically alter how ‘good’ data looks. For example, when I look at Rob Logan’s Data, he is a habitual trail-braker into the apex. Compare that with someone like a fast TaG driver, and the braking traces could not be more different, at least at the end when it gets most interesting. The point: multiple ways, and therefore traces, can be fast.
In my experience, most fast kart drivers conduct the majority of their turning effort prior to reaching the apex. Ideally, a kart should be rotated and ‘pointed’ towards your track out point by the time you reach the apex in tighter corners, while in sweeping corners some steering input is expected, albeit minimal. Next time you are at the track, watch one of the fast guys in a tight corner. Most of the time, you can note how the top of their steering wheel is pretty much ‘flat’ or neutral by the time they reach the apex of a hairpin. Again, this isn’t universal, but more often the case than not for the quick drivers.
With this in mind, we can imagine that the Lateral_G profile will suggest that most of the lateral loading a kart experiences occurs within the first 1/2-2/3 of a corner. If the ideal steering movements are achieved, then peak G likely occurs about halfway between the initial turn in point, and the apex. In the real world, this is really hard to achieve, as the handling of the kart, the camber of the track, tires, etc. all play a role. As an example of this, the elevation change at several corners at the Unser Karting Centennial track causes the lateral G trace to have two spikes in it–one for the actual corner, and one as the camber changes on corner exit, even when paired with video where we can see the drivers hands are straight.
To answer your question of why–which btw is always very important to ask–‘why?’ to anything related to karts if you want to master it: At the moment where the kart is truly rotating into the corner, this is where the Peak G should be the highest laterally, as this is where the ‘turning effort’ of the tires is highest. Again, all of this is in an ideal kart with perfect driving. Just like anything in the real world, real data looks much noisier.
In an ideal world, a pyramid/triangle profile on a trace would be the perfect input. Basically, if a driver drove in an ‘8-bit’ style, that is how the traces would look. But, as we know, even a kart can’t reach peak G and accomplish turning over a single instant.
I recently traveled to a job where I worked with 6-7 drivers under a tent, which gave me all sorts of tremendous data. Still, even the fast guys weren’t consistent on where the kart loaded 100% of the time. So, if you look at your lat_G trace and see a lot of noise or some inconsistency, don’t worry too much. Try to look at the big picture pattern rather than the micro-detail, because you can spend hours culling through each lap that way and not really come away with something to take on to the next session.
1 Like
Hi Eric, what are you thoughts on using g_sum as opposed to only g_latt?
A fantastic and thought provoking answer Eric - thanks for writing this.
I Like the comment about 8 bit driving. The big challenge with driving is adapting our digital thinking to what is one of the ultimate analog sports.
I’ve not done anywhere near enough race driving to understand how it works - but my naive mental modelling of the process has the driver adjusting steering and speed in exactly the ratio required to maintain a flatline of maximum cornering effort throughout the corner. With our cyborg steerer doing that I guess the g trace would then exactly reflect the personality of the tyre.
How I long for that dreamy utopia … sigh
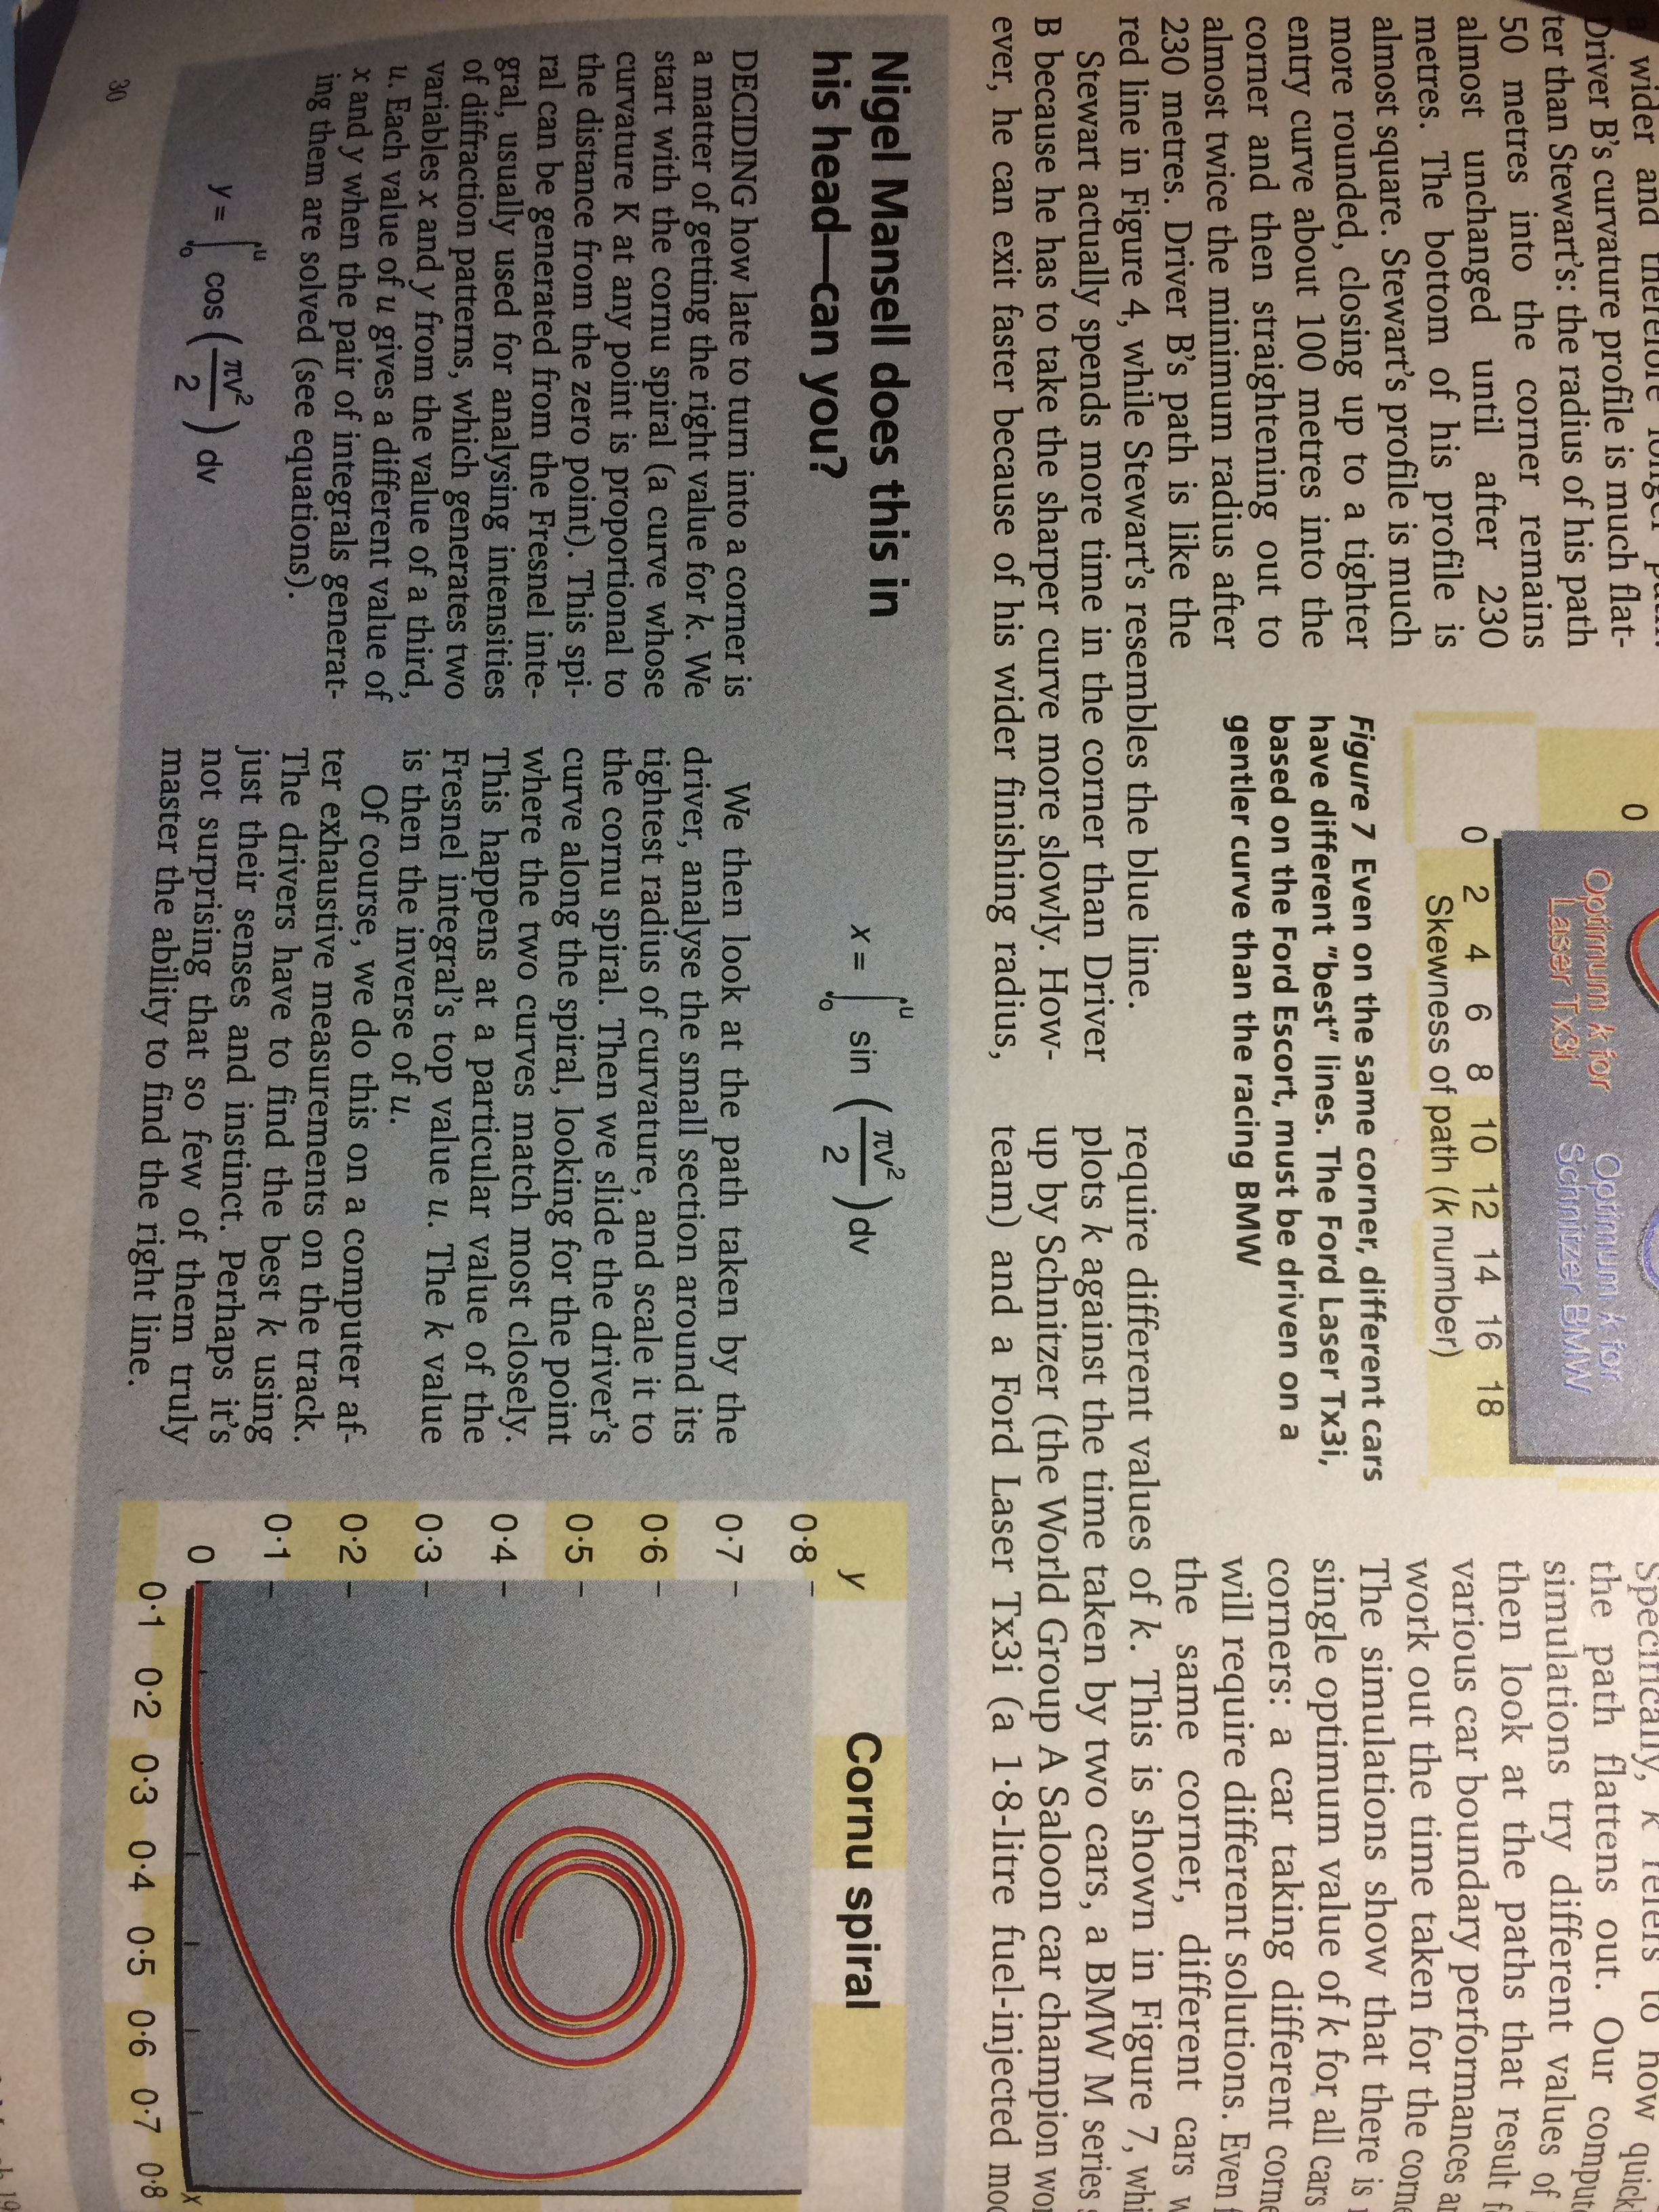
Anyway, New Scientist wrote a fascinating study about this in 1993. I’ve sat on it since then knowing that when life gets more conducive to regular racing, I’ll deconstruct and digest it. only 24 years have passed so I guess there’s no hurry.
Good to talk. Have a nice day.
Lee
@Marin_Vujcich I remember learning about g_sum and I think it’s a great tool! For most drivers I work with, I don’t delve into g_sum first and foremost. As I will explain below, while I think that G_sum is really helpful in chassis and driver development, I tend to not utilize it until I’ve been working with a specific driver and chassis for some time.
The reason I say this is because while g_sum does give you an insight into how much grip/potential the kart is under at any given point, that doesn’t always correlate to a positive thing. Depending on the chassis, tire, driver, etc., the ‘ideal’ G_sum can really vary a lot. For example, when I drive a kart that is run on ultra hard tires, a G_sum of 1.5 through the corners sustained is great and near the limit. Compare this with a shifter kart at Calspeed, where G_sum (or even just Lat G) is pegging near the 3.0 g mark, and you can see where the wide disparity lays. G_sum is very helpful when you’ve worked with a specific chassis for a long time, and you understand ideally what ‘good data’ looks like.
With that said, I really think it’s a very helpful tool, especially with the older drivers, as I’ve found for some reason shifter kart drivers especially gravitate to it more. I suspect this has to do with the fact that in a shifter the braking and turning traces/forces are much higher at the same time because of how hard they are on the brakes up until the apex, but that’s just my guess why they find it more impactful.
Ultimately, my final comment on it is whatever combination allows you to interpret what the data is telling you, utilize that. For me, G_sum is a neat tool, but usually by looking at the lon_g and Lat_g I can tell more about the driver throughout the corner than I can with G_sum. That’s just for me personally.
1 Like
@Motormouse that’s a pretty neat excerpt. I understood some of those words!
But in all seriousness, I do find the idea that a driver could truly be digital to be taxing. We all like to think we are that precise, and that repeatable. But in reality, at speed (at least for me), it feels like there is a certain combination of things I can input into the car/kart, and then there is some that the mechanical system just sorts out on its own due to my inputs.
As an example, with my drivers in coaching I often really focus on their initial turn-in habits in tighter corners. To me, getting this motion and action correct leads to a proper line and chassis behavior through the rest of the corner. Get the initial inputs wrong, and the kart won’t react as you wish.
1 Like
Thanks for the reply
1 Like
Tony,
Could you post a picture of what you mean about the saw tooth shapes you’re seeing? Are you zoomed waaay in?? Are you on a MyChron 4 + GPS05, or the MyChron 5?
IMHO the MyChron 5’s GPS system seems a good bit more accurate and reliable than the 4 + GPS05.
At the end of the day you need to keep in the back of your mind how this particular channel is created. Both systems are using GPS positional data that is only being recorded at 10HZ. Race studio calculates the rate of change of position between each point of data to provide your GPS Speed, GPS Lat/Lon/Z G forces, etc. Because the data is calculated, rather than measured (in the physical sense), it’s already “smoothed”. I think the “saw tooth” you might be seeing is just a consequence of the sample rate being 10HZ, which is VERY low for measuring anything in motorsports. A LOT can happen in .100 seconds. At 60mph that’s 8.8 feet in between each point of data.
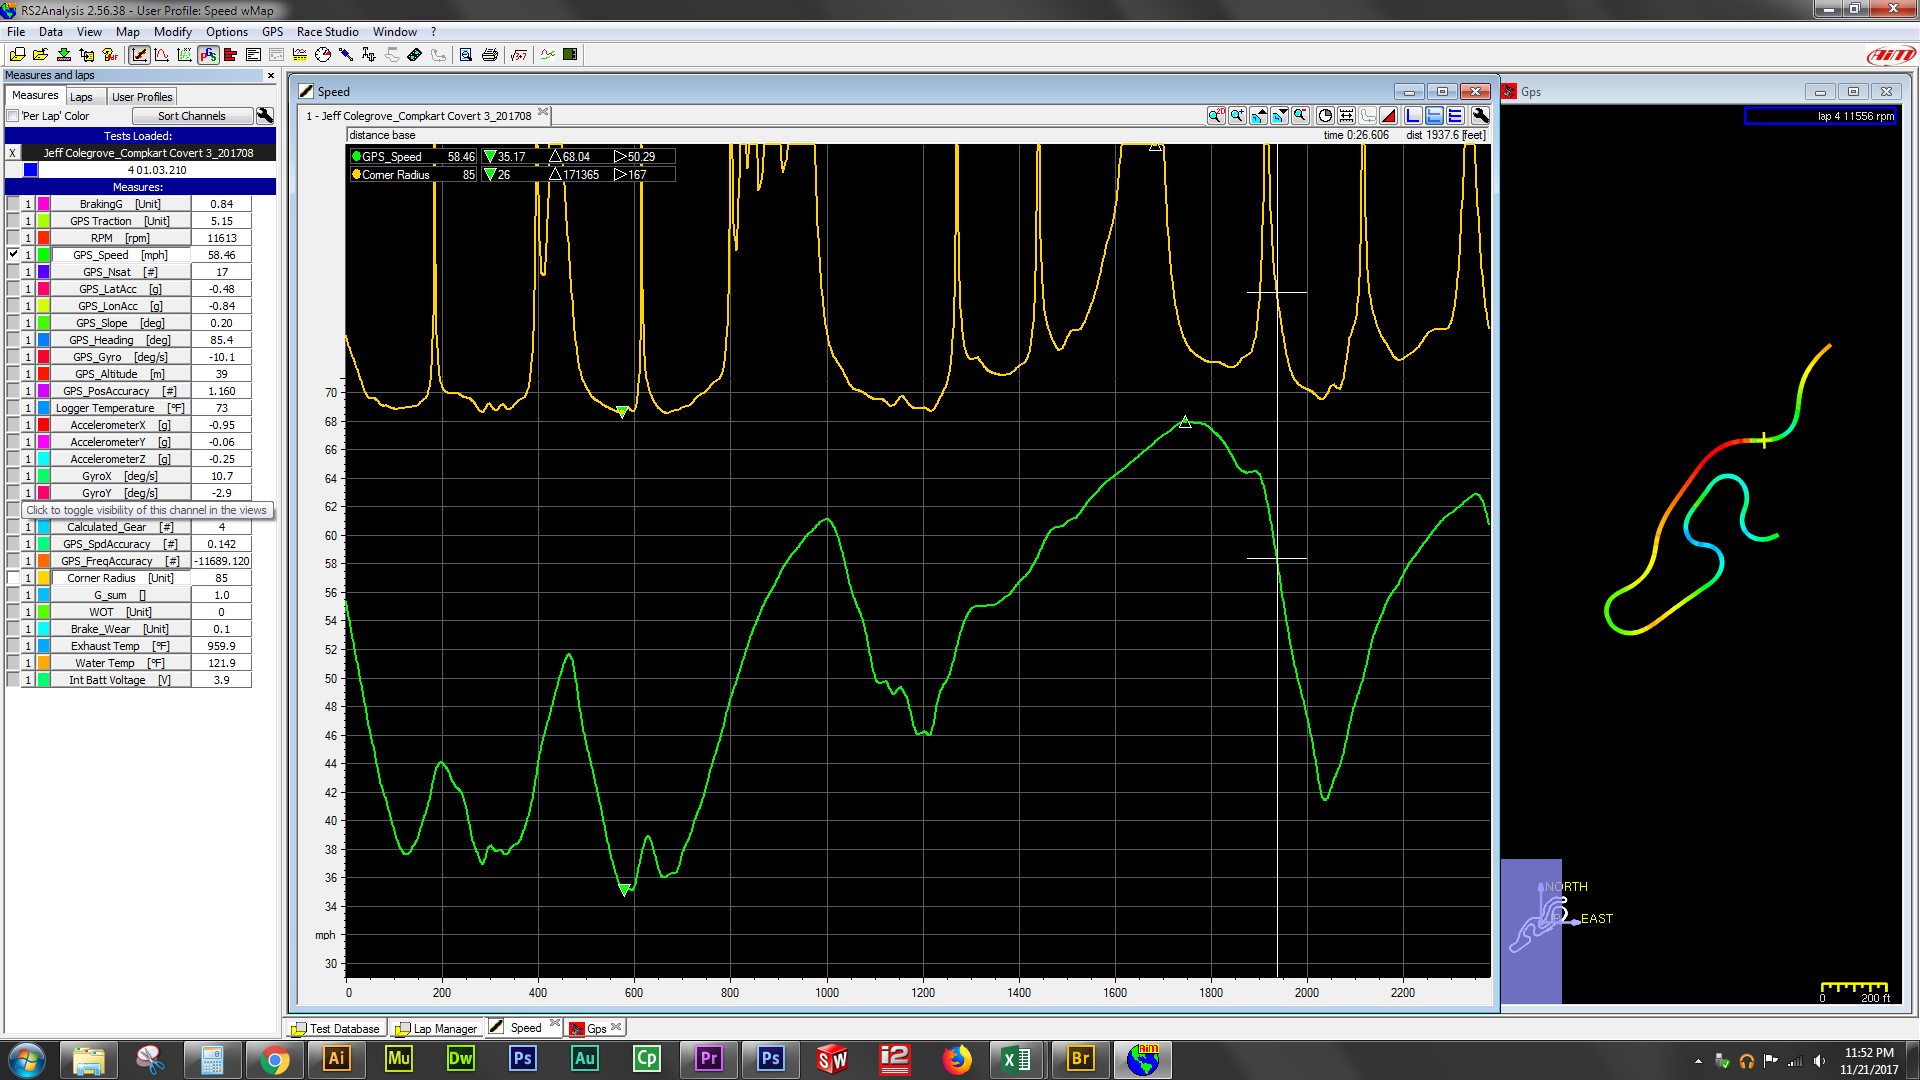
If you want something to measure your “smoothness” as a driver, create yourself a “Corner Radius” math channel. This will factor your speed and rate at which you build G Force, and provides a nice graphical “picture” of how you bring the go kart from the turn in point into the apex, and unwind it afterwards.
Here’s a picture of a user profile with GPS Speed in green and my Corner Radius channel in yellow. If you don’t run a steering sensor, corner rad is a seriously valuable piece of information to have, especially when comparing how two drivers approach a corner.
2 Likes
I also feel like AIM puts too much weight behind the GPS system. I miss my AIM Drack Gold.
The new GPS08 system uses both GPS and GNS constellations. It seems MUCH better than the previous system they used.
1 Like
I know its better then it was before but I’m not a fan of all the smoothing. If I do it myself then i know whats real and whats not. When its done in pre-processing of the data then the data is pretty but inaccurate. Like you said, its sampled at 10 Hz.
I still prefer a wheel sensor and ebox for true data analysis.
1 Like
With the GNS constellation being used as well I think you could consider it 20HZ, or a 10HZ signal that’s being corrected by a 2nd independent system…But I get what you’re saying. They’ve taken most of the noise out of the MyChron 5 3-axis accelerometers at this point and I’d say they’re usable. Those are sampled at 200HZ and interpolated to 50HZ for recording.
2 Likes