I never noticed a discrepancy between the delta and the rest of the traces, and I tend to dive pretty deep into data. Ever since sending my Mychron to AIM to check it out, I can’t do a delta since it just shows ft for distance, even if I make a track with that session’s data. I just keep waiting and figure I’ll try a newer release, but at some point I’ll need to get their help. When I tried before, the canned response irritated me too much to continue
This is from a while ago, I used some image software to overlay RS2 vs RS3 delta. I would assume they should match up exactly. Yellow vs white. They almost match up, but the discrepancy is significant.
If you are willing to share more insight on what could be misleading when using time compare, I would be interested. Time Compare is one of the key functions that I use.
It is also interesting that the way I use data for a kart is different than for a car, which might related to the amount of kart (20+ years) vs car (<1 year) experience and where I’m on the learning curve. The big difference is that I’m not a point where it’s worth tuning the car so I use the data exclusively to improve my driving. Whereas in the kart, I used data to tune the kart and much less so the driver. The use of camera footage seems to help a ton to improve my car driving.
There are several different ways to do a delta - it actually isn’t perfectly straightforward since you have to decide how to treats laps of different total distances. Unless you have a perfectly repeatable line, there can be a decent difference in lap distance or segment distance, so my guess is they changed how they do it.
I just normalize a lap distance to 1 and compare by lap fraction (so the delta is taken when both laps are at the same fractional distance). It is simple this way and just fine if the lines are similar, but a more robust way would be to normalize each segment distance instead of the total lap.
The worst way to do is to not normalize at all and just use the reference lap distance, so the delta is taken at the same distances. If one lap is several feet longer or shorter, you’d have to just pad the delta.
There’s probably other valid ways to do it, too, so my guess is they went from one way to another. I’m too bitter to assume they improved it, but to be honest, you’ll probably draw the same conclusions from the data whichever basis is used for the delta
During Covid, AiM began conducting webinars once a week and posted them on YouTube. They are still being conducted but on a monthly basis. A lot of information to help adjust to RS3. Roger Caddell I’ll assume would be interested in topics for upcoming webinars and answering any questions.
Are you able to normalize in this manner within RS3, or is this something you’re doing in Excel?
Python. My RS3 can’t do deltas since it refuses to do anything distance-based, even with custom tracks from the data itself. I’ve ditched RS3 altogether except for pulling the data off the Mychron and for occasional deep-dives, but the zoom feature in RS3 is so terrible, it is nearly useless. I have better results most of the time just zooming my own PDF. It is also nice that I can store it to google drive and open it from my phone, so it is nearly like have a data app. I am 99% done with it, so I’ll make its own thread once I am done polishing it. I may try to see what difference it makes if I normalize distance per segment, but I doubt it’ll be worth the effort. While the plot may change a little bit, I don’t think the conclusions will (in other words, the better curve will still look better). As someone pointed out in another recent thread, the GPS accuracy isn’t good enough to get too picky. They might give you several digits of precision, but that doesn’t mean they are accurate. At some point, you just have to squint and look for general trends versus precise data.
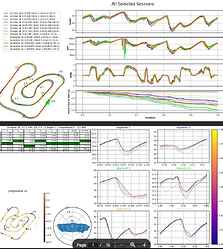
Here’s a preview though of a session summary, fully automated. First page is a full summary, and then each page after that is a session breakdown. This way you can flip through and see how the day progressed and compare to other days/sessions.
Well that’s cool! Interested in seeing how the development progresses.
Before I derail this thread and get scolded, I went ahead and made my own thread here:
Do we scold here? I hope not ![]()
Haha, I did mean that very lightheartedly
@dodo is wayyyy out like 3 sonic booms ahead of me in understanding, but essentially if you don’t normalize each lap relative to the correct datum the time compare makes no sense.
Put simply - it will go up when you intuitively are used to it sloping down, etc. You just have to take the extra time to make sure the fastest lap is the lap you are ‘normalizing’ others against. Let me know if that helps clarify!
Even then it produces a way different plot to RS2… Leaving you to wonder if there is a bug, or if rs2 is wrong, or both! ![]()
I was well away with rs3 until I noticed that the delta and speed traces didn’t make sense on one corner per lap
I would get a delta showing improvement, where the speed was lower.
And I certainly have the correct lap as the comparison… Which is a bit of a headache, I wish it would default to fastest and then allow you to change if you wish.
The only way I can imagine it being correct is if it is saying your line was shorter and you actually made time… But these drivers don’t change their line.
There’s certainly a fundamental difference between the delta plots in rs2 and rs3
The fundamental shortcoming with looking at a delta is no two laps are the same distance, as you know. 1000’ into your fastest lap will be a different place on the track than 1000’ into your second fastest lap. You can improve the software by resetting that distance each segment, so you are now just comparing 100’ into segment three, for example. RS3 automatically divides a track into straights and corners, we know. We also know the delta doesn’t match. That leads me to wonder if it resets the delta ref distance by segment or lap feature (like straight or corner).
The idea is that, say you go way off in segment 1. By the end of the lap, your distance traveled will be much farther than normal, but your last segment might’ve been a personal best. You can’t throw out the whole lap’s data because of one off. A smart algorithm can salvage the good segments, and a dumb one will, too; they’ll just look different to each other.
If you’d be willing, can you export the two full sessions to CSV that you found the difference between RS2 and RS3 with and send those to me? I can play with some things and try to recreate both styles of deltas and see if I can figure out exactly what they did differently. PM if you want me to
@dodo - bear with me here, as I’m thinking out loud…are you able to quantify what a normal variance in driving lines/laps translates to in terms of distance traveled for each? Assuming a driver is executing a series of repeatable laps and driving lines, I’m not sure the range of distance traveled per lap would be significant, and if it is then maybe the driver isn’t at a skill level where combing through data is a worthwhile endeavor. Maybe you’re utilizing the delta differently than I am, but I believe the software is still comparing laps across a standardized track distance, right? If that’s not the case, then the split comparison still have the ability to normalize segments across a fixed distance (if I’m understanding correctly).
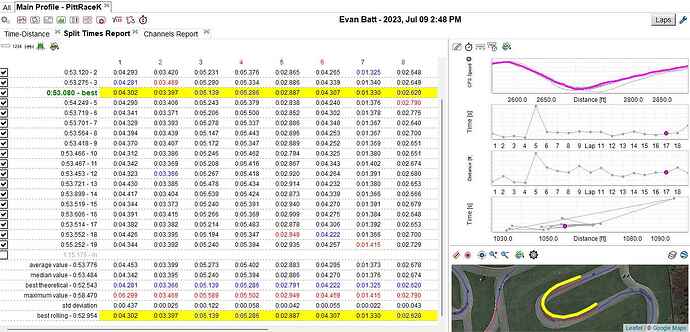
Here is a snip of a split comparison from one of my races this year in KZ Masters at Pitt Race. The highlighted segment on the map is one where I had a huge moment on lap 5 and you can see that in the graphs on the right of the screen. I believe the top graph of speed vs. distance is displayed in the same manner it would be on the main time/distance comparison. The fourth graph does show a that lap being an outlier in terms distance traveled, but if the entire lap is normalized over a fixed track length then I’m not sure the distance traveled is really throwing anything off. After all, fastest way around a (normal) corner is to minimize distance anyways while maximizing radius.
Who knows, maybe I’m missing something here, but I have zero issues with the delta function and lap comparison. The GPS trace on the other hand is totally useless. If anything it just helps to have a map so as to eliminate confusion on what corner is being discussed, but video is still the way to go for fine tuning a driver’s line.
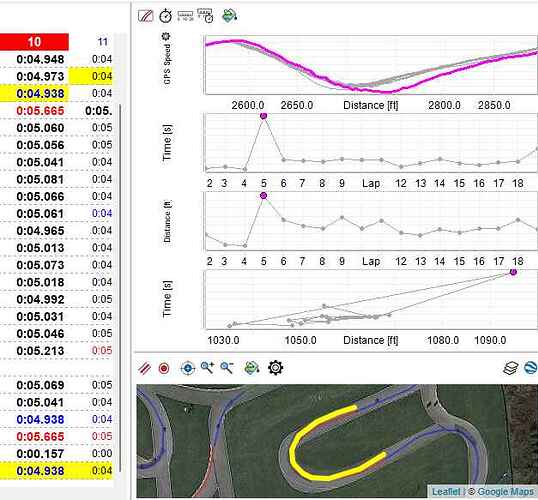
ADDITION: here’s a view with segment 10 (corner in question) data in view, and the turd lap highlighted in the graphs:
I’ll do a better read and response tonight, but my knee-jerk is that “not much difference” in distance is hard to quantify. Dove’s post above had a delta time of just dozens of milliseconds which correlates to just a few feet at 70mph ( 1 foot = 9.7ms @ 70mph). I’ve only studied my own data and my 5yo’s data, so I don’t have any idea what good driving looks like, haha. I’ll dig through your post a bit more and see if it is just a matter of a small phase shift or something else. My theory is you won’t see Dove’s problem until you start getting down into millisecond differences really mattering, and then small distances can be huge.
The fact that data from various sessions over the season do not line up precisely has always bothered me. Because of this I always used the axle speed for determining track position. Axle speed data always lined up, even data from other karts and from sessions years old lined up with no need to nug overlays to line up. I would think that if there are offset errors in the GPS then there are likely position errors being generated throughout the lap, which would introduce errors in the time delta plot. One caveat, this experience is based on My4 and the GPS module, never went to the My5 series because it wasn’t worth it. I know that Ryan Norberg was still using the My4 a couple of years ago.
As well as the whole RPG team…probably for the exact reason you described above.
They are doing some kinds of tricks in the Mychron 5 to help, but I’ve not figured it out yet. The positional accuracy can be really bad sometimes, but it still draws a smooth line. They seem to be employing some kind of cleanup which is fairly common. In the automotive and DoD worlds, accelerometers are bad for measuring speed and position since they can drift over time, but they are much more precise than GPS. By mixing the two and using some logic, you can play them off each other to get a good signal. I assume AIM is doing something like that or else the position trace would be really choppy and noisy. Since they changed hardware a lot from 4 to 5 to 5S, I assume all three had different approaches to sanity-checking the positions.
It would be interesting if someone ran both the 4 (using wheel speed) and 5s on a kart, followed up with analysis using RS2 and RS3. The problem might be in creating identical segmented track map.
If accelerometers are being used to compensate, one wonders what errors are caused by the My5 moving about in space mounted on the steering wheel. The My4 motion sensors were in a separate box from the display.


