KZ Jetting Deep Dive

There has been a lot of great dialogue in @Andy_DiGiusto’s KZ Cost of Ownership thread, some of which has ventured into jetting-related conversations. I’ve been doing a lot of thinking on this topic lately, so I figured it couldn’t hurt to start another topic to discuss intricacies that are not often discussed out in the open.

First off, kudos to Andy for sharing his experience on this topic, and KZ in general. His knowledge has certainly helped demystify some things for me, as I’m sure it has for others. One thing that I’ve found, and would like to emphasize for others, is that it is very easy to get lost in the weeds, and overcomplicate things. As others have alluded to, large jetting changes in the wrong direction can result in catastrophic failure. As Andy has mentioned in his recent thread, it’s best to keep things simple.

That said, for those interested in going down the rabbit hole, here we go…

As with anything in racing, many of us have our greatest learnings through good ole trial and error. I have enough experience in this sport to generally keep me on the right path, but I’ve certainly made a couple of errors with regards to jetting in the last year that have humbled me. The compilation of these errors, combined with a commitment to running a full season of KZ (Masters :wink:) in 2023, has prompted me to seek a better understanding of the Dellorto KZ carb.

The aspect of the Dellorto that I most undervalued was also the source of the aforementioned errors: the Conical Needle. Upon viewing Dellorto’s needle chart for the varations of the K-series needles, it can be tough to know where to start. Additionally, most people have a tendancy to instead focus on the main jet size, and not mess around with the needle beyond changing clip position. Provided one starts with a reasonable needle out of the gate, the set it and leave it strategy is the best way to go for MOST people. However; for those interested in tinkering (lord knows I’m one of these people, for better or for worse), there are a couple of important points to keep in mind:

  1. Some needles will flat out not work for your application
  2. Dellorto’s needle numbering system, e.g. K1-K98, does not follow any sort of logical progression. In other words, you can’t expect to go from a K28 to a K29 and experience an outcome at all related to a “one point” progression.

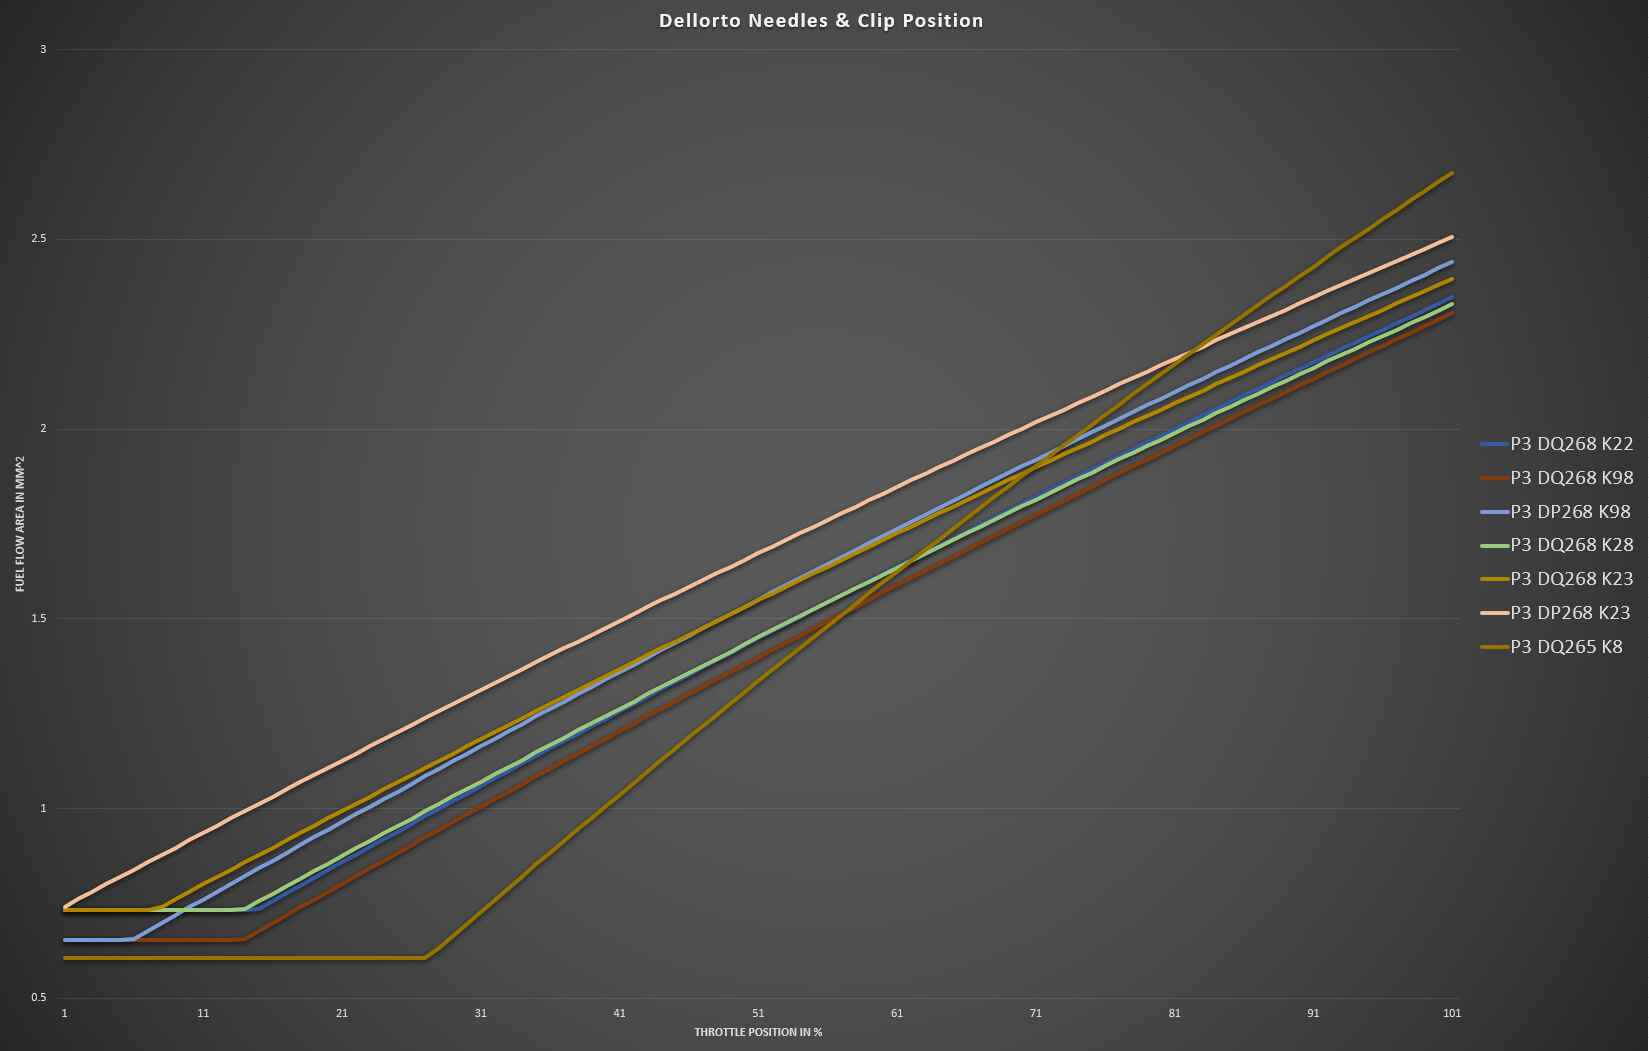
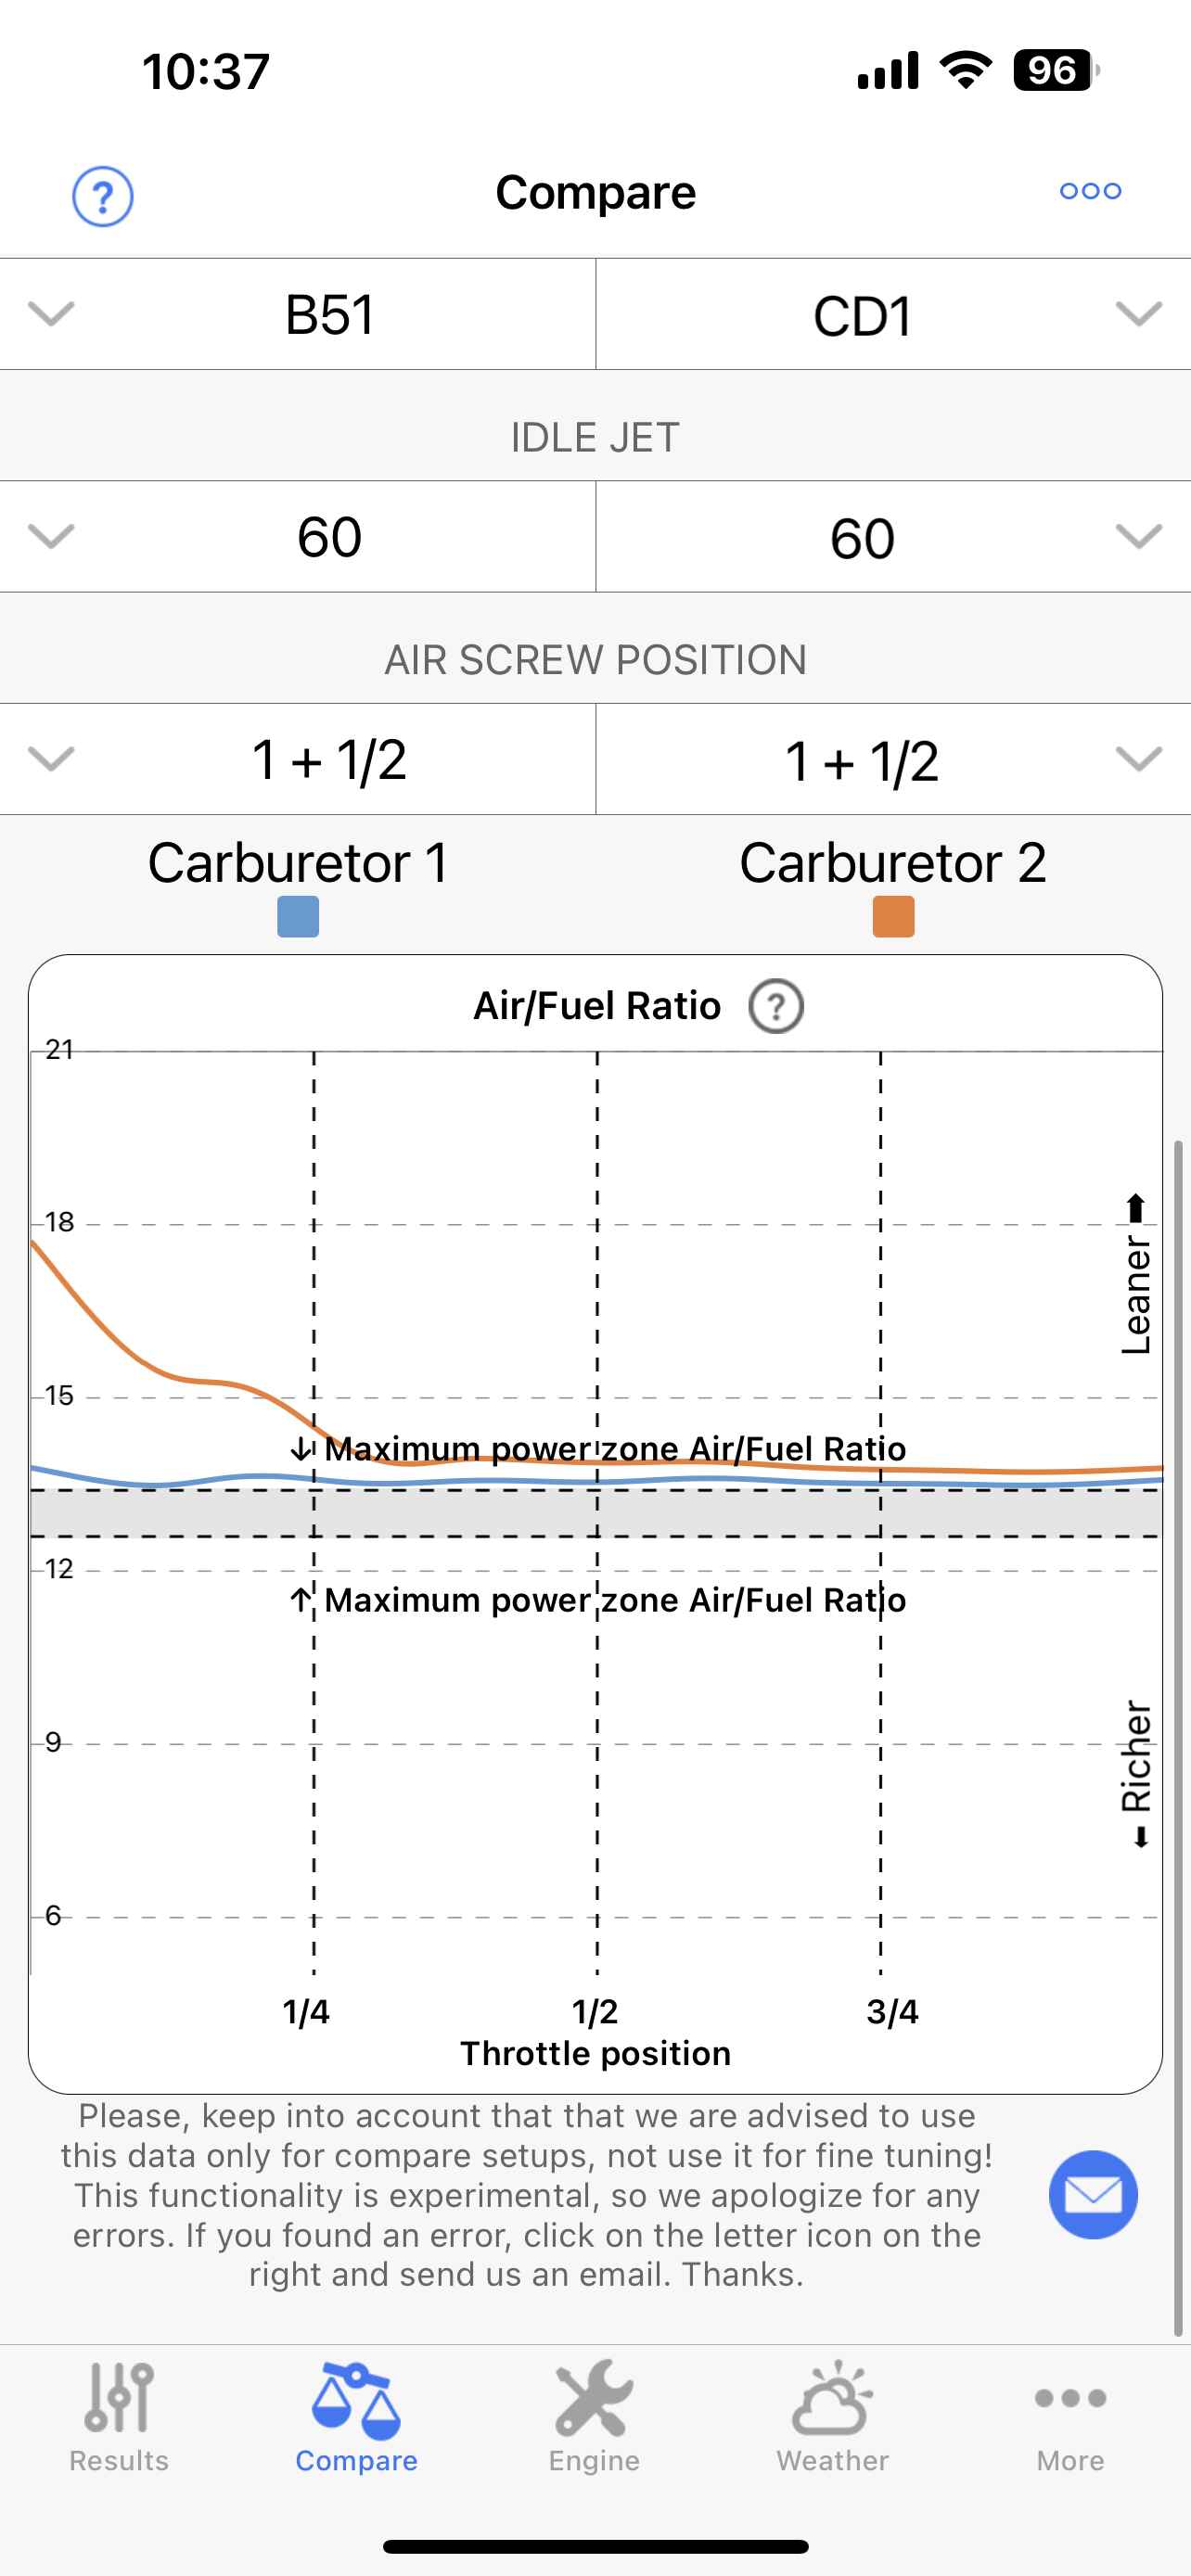
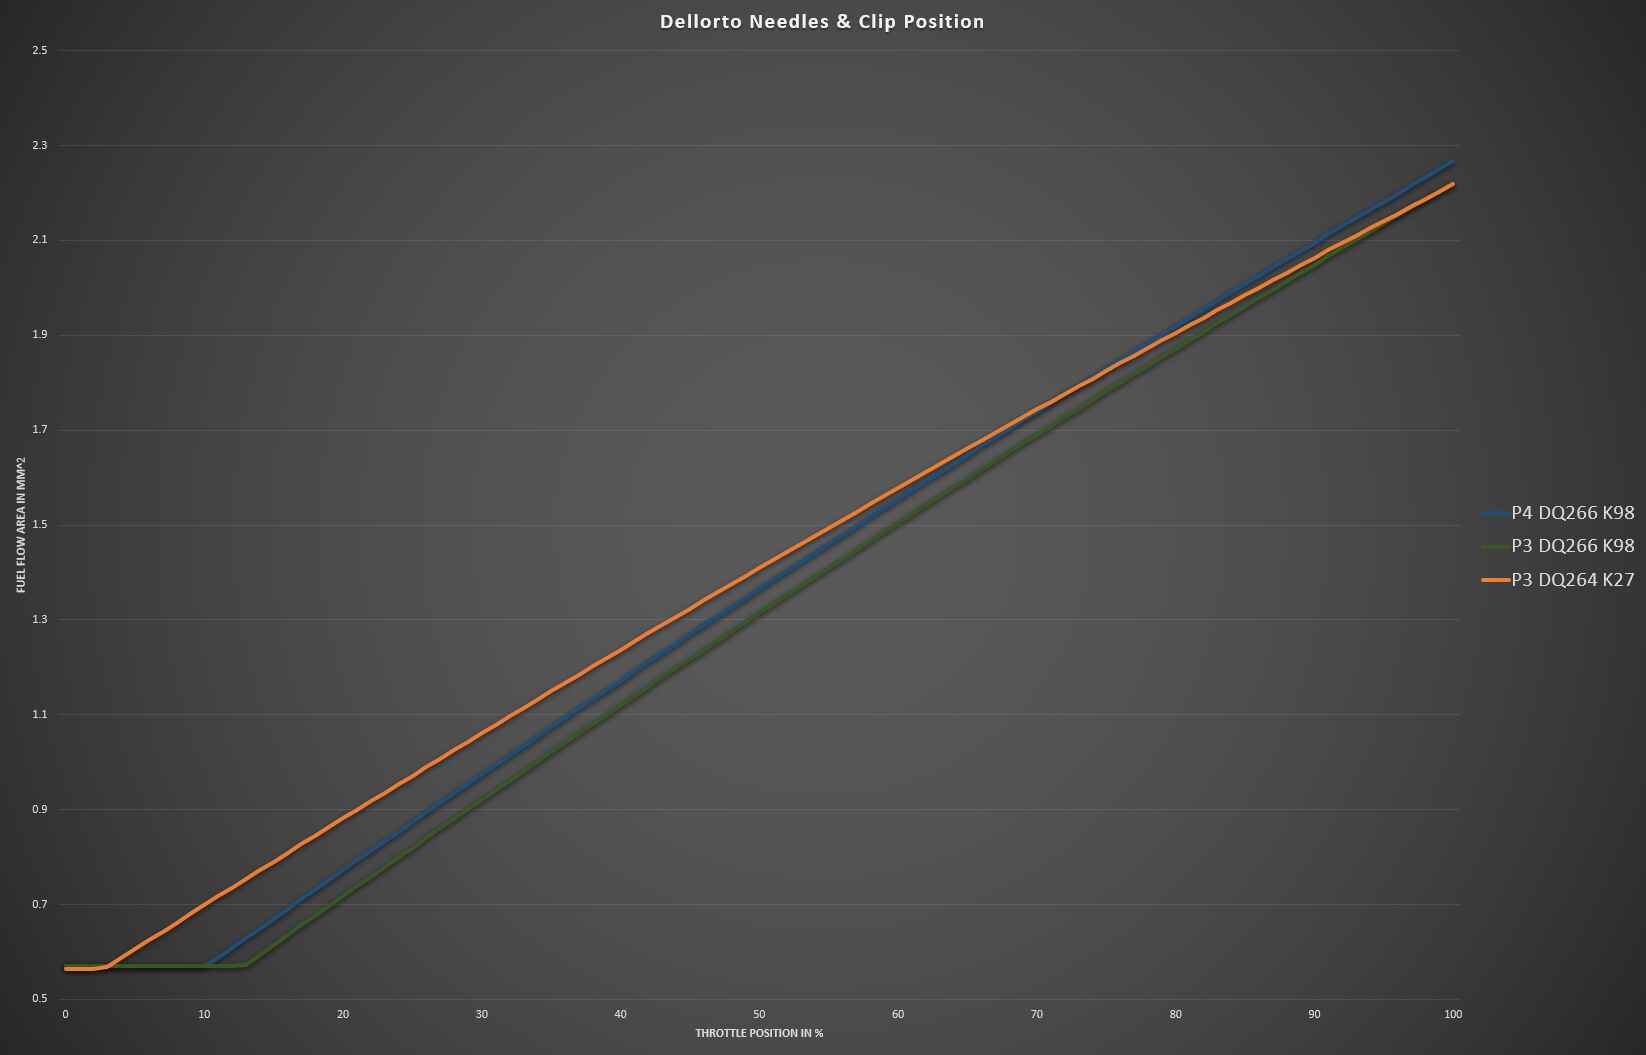
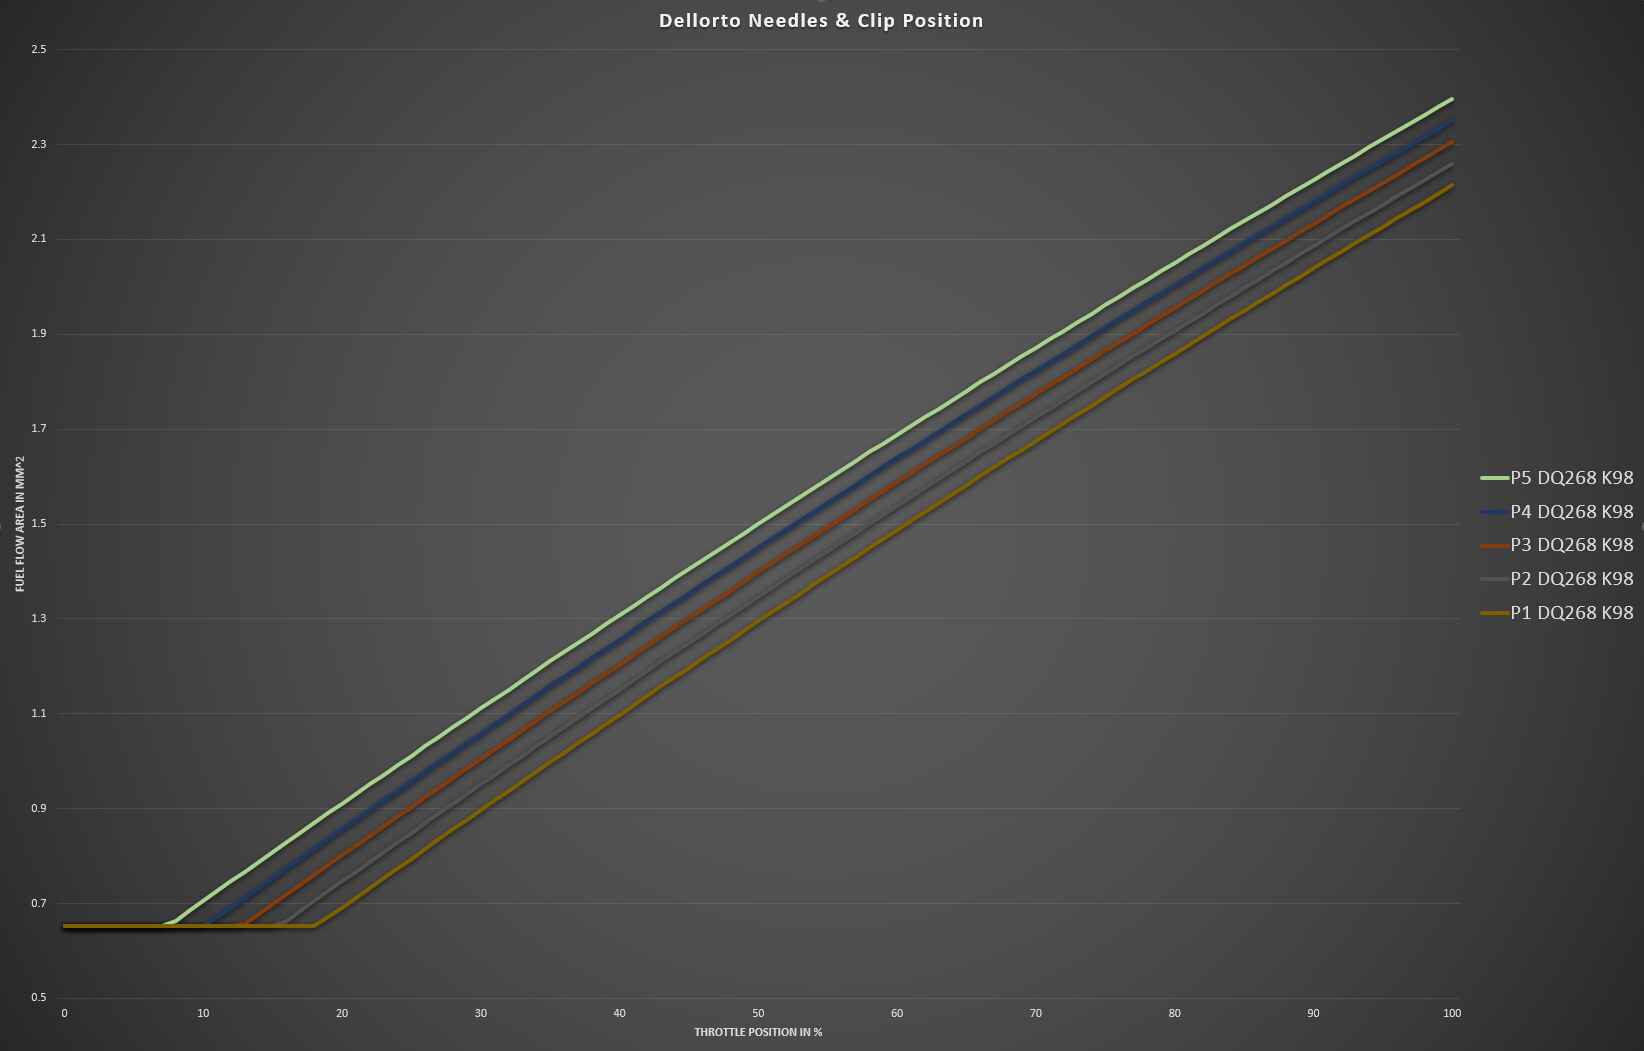
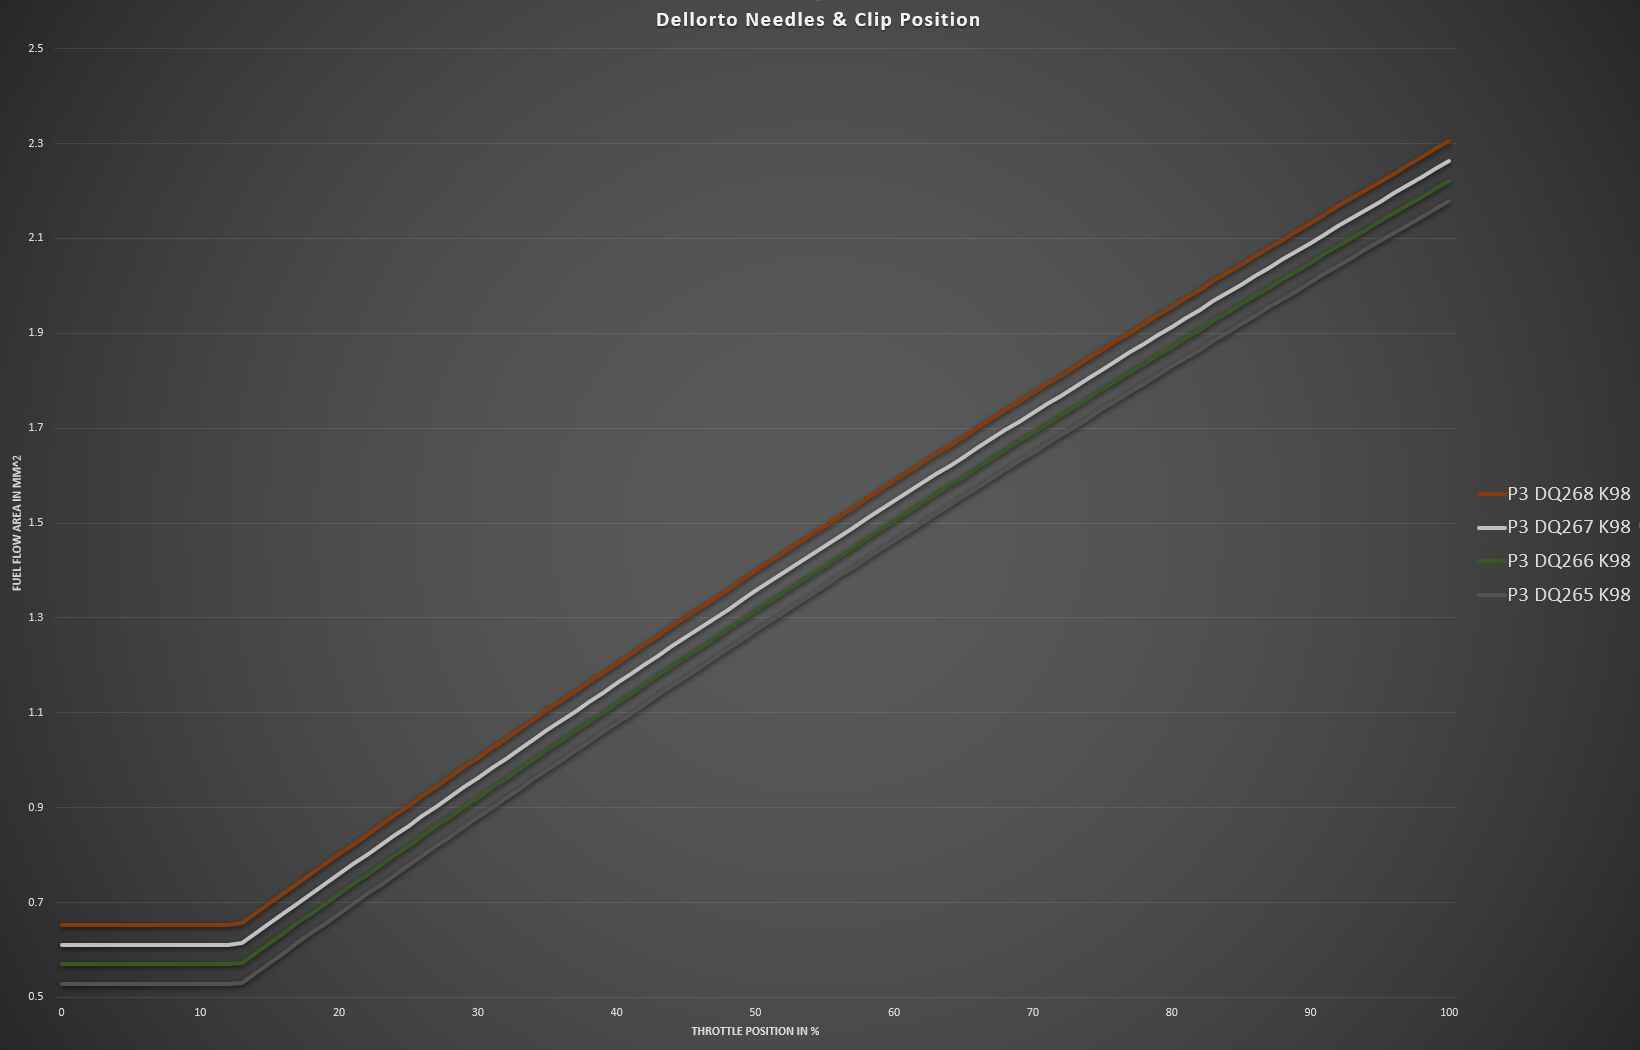
So I took some time to identify needles that might be remotely relevant to my application (TM KZ-R1), and mapped their characteristics in an Excel file by graphing fuel flow area (within the atomizer) vs. throttle opening percentage. Below is an image of some of the needle combinations mentioned in recent threads by @Andy_DiGiusto, @Lborka, @ohasha, and others.

Before getting to that, here are a few caveats to mention:

  1. This graph only takes into account needle, clip position, and atomizer size. Essentially it assumes that ALL other factors are constant (main jet, idle jet, etc.).
  2. This strictly captures fuel flow vs. throttle position. This is not based on RPM. Right end of the graph is WOT, left side is throttle closed.
  3. This does NOT factor in any fuild dynamic principals, or anything or that sort that may affect the real world outcomes. I’m not an engineer, and I have 0% knowledge on fluid dynamics, and frankly most things.
  4. Number of clip positions available on a given needle matters. Some have three, four, or five positions, with each configuration having different spacing between each position. The K8 mentioned by @ohasha is one that I don’t own, so for simplicity I assumed it to be a 5-position needle, and can easily update the output if it happens to be another configuration, though it will not drastically change the output.
  5. I’m not sure why the x-axis goes to 101. Unless you’re a far more gifted driver than me, just ignore that last 1% :laughing:
  6. This graph may not be free of error. I compiled data for 12 needles, their respective clip positions, and four different atomizers for most of these needles. There was some geometry involved, which really tested my Googling skills. I feel confident that my data and logic are sound, but you know…errors can happen.

Anyways, this was a fun little project. Whether or not it makes me faster this year will be a whole different issue :grimacing:

5 Likes

T H A N K Y O U! This is invaluable!

1 Like

Great idea! It makes all sense! I think this is an awesome graph! Do you account for DP vs DQ length or is it tube diameter only?

I think the graph captures the most common needles I see being used (K22,K23,K28, K96, K98) so it’s not true that you need dozens of different needles…with those and few tubes and jets you can cover a ton of possible combinations and as you can see from the graph, all pretty close, except the K8 example, that’s why it sparked the question.

The one caveat everybody needs to be super aware is also the interaction with the main jet, as you pointed out your graph is not including that part.

In the K8 example, you can see the lean spot at the bottom,that’s what I was mentioning in the other thread, which is given by the needle/tube combo restricting flow, regardless of the main jet. Then your graph shows it gives you increasingly more fuel than other setups due to steeper ramp and smaller tip. True, all else equal BUT if you add the 3d variable (max jet) and let’s say you throw in a 150 while all the other setups are using a 175, that mustard line would be coming down quite a bit once you cross the 80% opening and would be dipping lower than all the others, revealing the second lean spot as the the jet would not allow fuel to go through at the rate that tube/needle combo would otherwise allow.

Super interesting!

1 Like

Definitely intended to be a starting point. As I’m sure more questions and conversation will come from it. Either way, I’m happy that you take something away from this.

I accounted for tube length on the DP268, and only mapped it for the K98 and K23. DP268 was the only one from the DP series that I mapped, as DQ seems to be used more frequently. For those I did DQ265-DQ268.

This is a great point, and one I’m still working through understanding. I’m trying to visualize the main jet and tube/needle combo as one system, and one with a bottleneck that may occur at either end depending on the size of the components used, and also % throttle. It seems like at WOT the open area of the atomizer tip is what’s most important, but that’s of course only as good as the amount of fuel making it into the tube via the main jet. There also seems to be a similar-ish relationship between the inner and outer pilot jets. Do you have any advice on how to better understand these systems?

I feel like I’ve seen carb setups with more “standard” needles such as the K98/DQ268 using larger main jets, and more “aggressive/responsive” setups such as the K8 using smaller main jets. Could there be some sort of rule of thumb established there, or should this instead be chalked up to motor variation and such?

Great idea! The Vhsh30 could have quite some configurations :laughing:

Excel defaults the x-axis to start at 1. Create another column for throttle position next to the fuel flow area mm^2, starting at 0. Highlight both sets of data. Select “Insert” from the ribbon menu, then pick the 2 D line chart icon. Then select the chart and left click and then pick “Select Data”, which will bring up a popup menu. In the lower right hand box (Legend Entries (Series)), select the “Remove” button and the item Series 1. In the lower right hand box (Horizontal Axis Labels) pick “Edit”. In the pop up, select the data (Throttle Position) with your cursor and press “Ok” and “Ok” again. Put the cursor on the X-axis numbers and left click, there should be a box around the X-axis numbers and the Format Axis menu should be on the right side of the screen. Scroll down to the bottom of that menu and pick “On tick marks” in the Axis position menu.

Wow, complicated to explain, so it may not work.

Thanks, Larry! Super easy. I hadn’t payed attention to the axis labels in the “Select Data” dialogue box, so going that route was a quick fix. Much appreciated!

Going back to the modelling, check the answer on the K8 jetting, seems to be a regulation-driven setup rather than a performance-oriented one, but in general with smaller tube you try to have a thinner needle to maintain the same effective area at wider opening, but a different transition in-between.

I think the key in modelling this is understanding how to estimate the effective passage area, overall. Leave the min circuit aside for a sec (other can of worms) in general we can assume that until you get to 50% opening, it’s all driven by tube/needle ratio regardless of max jet. I think it’s a fair assumption, unless somebody goes crazy small on the max jet, death sentence. Past that, there should be an assumption that the area available for fuel to flow is the minimum between needle/tube area and the area determined by jet size. So let’s say at a certain throttle opening say 90%, the available area is 2 square mm based on tube/needle combo but you are running a 160 max (area is 2.010), that means you are about to hit a ceiling, so past that you are constrained by the max jet, regardless of the increased opening. So your graph at some point should flatten when the max jet becomes a restriction.

All good but so far we only talked about flow based on space available so we are saying past that 90% you are flat as you are constrained. But what happens from a stechio standpoint, is that between that 90% and 100% the engine is still revving higher and higher ingesting more air, while fuel supply won’t keep up due to the restriction = you get progressively leaner as opening and revs go up past that 90% so the flat area should in reality curve down when you look at it from an A/F ratio standpoint.

Hope this helps instead of complicating things…but in a nutshell I think the model should include that ceiling, together with a breakage of the area/fuel flow relationship once that happens…I’m not an expert in fluid dynamics but intuitively that’s what I think it happens

1 Like

I definitely see where you’re going, and I think that is an added layer of complexity that I’m not currently equipped to account for. The graph in its current state is merely intended to measure each combination relative to other combinations. Even the introduction of the ceiling you mention (which makes sense) begins to depend on atmospheric conditions, and that’s a level of complexity that is beyond my reach. The factors you mention would be crucial if someone were to make a full blown jetting app, which I’m in full support of if you want to take on that endeavor :grin:

I actually think there is something somewhere. I believe there was a jetting software that had even more sophisticated stuff in it, showing the final curve compared to a theoretical stechio. If I recall correctly, it started from surface area calculations like we are discussing here, but then calculated fuel flow based on opening, rpm, fuel and air density (derived from temp, altitude, fuel/oil ratio etc) and then calculated a stechio curve from that. Pretty complex, I’m 100% sure I’ve seen it, if only I could recall where

@Muskabeatz would you be able to run another few setups into your graph? These were created in NT project (300 euro software for carb setup) a few years ago by a mate which had bought it. Then we could get some comparisons of benefits or lack there of between software, default setup and builder setups.

170 Main__________168 Main___________168 Main
K27 p3____________K98 p3____________K98 p4
DQ264____________DQ266____________DQ266
B48/60____________B60/60____________CD1/58

I’m currently using this app in combination with a weather station at the track to have more exact data on the weather.

The app uses iPhone own built in pressure sensor to be more accurate!

You can compare 2 different carb configs against each other, and you put in you engine data etc

Then it gives you multiple different carb setup choices, you can even play around to see the afr curve and what different needles or positions does. Works great!


1 Like

Yes, see below. A reminder though, that my spreadsheet and graph ONLY captures needle/clip/atomizer combos, and compares relative to one another. I don’t have the capacity nor the smarts at the moment to take it to a full-blown jetting app by factoring in atmospheric conditions and AFR. Also factor in some of the points Andy made above. Essentially, my chart gives you PART of the picture, not the full story.

With your setups however, the main jets are all so close that we may as well assume they are the same (168) for the purpose of this illustration, which makes things easier. The idle jets are going to primarily affect the first ~15% of throttle opening, so we can infer those affects on the curve based on the respective inner pilots you mentioned.

For those that may be still wrapping their heads around the basics, here are two illustrations that may help you visualize in the way it helped me.

1st- Clip Position. Lower number, e.g. P1 (highest position on the needle) shifts the curve to the right, and higher number, e.g P5 (lowest position on the needle) shifts the curve to the left.

2nd- Atomizer Size. Changing the size of the atomizer shifts the entire curve up (larger size = richer) or down (smaller size = leaner)

2 Likes

Evan, here you go. Hope the model makes sense. If it works, you can incorporate logics into your spreadsheet as it looks much better. Inputs in second tab, yellow cells. Calculations are in second tab below, see excel. If somebody here has some time to spare, it can be replicated to compare lots of different combinations

Below is a comparison between K23 and K98 on same nozzle and same max jet


Test.xlsx (48.7 KB)

1 Like

Note what happens when you bump max jet from 160 to 180 on both…it basically goes back to yours

need some help in double checking calculations to make sure they make sense, haven’t had much time to spend on it…but should be directionally ok

This is awesome. Thanks, Andy! I’ll dig into your file when I have some time. Directionally it seems spot on, as any little differences (needle protrusion, clip calculations, etc.) shouldn’t affect too much. One side note, I found it easiest to measure the clip positions starting at the bottom, as there is some variation between the 4 and 5-position needles with regards to starting position and notch spacing.

It’s funny to see your method of calculating the conical portion of the needle, as mine was painfully and unnecessarily more complex. Not sure why I didn’t think to do it the way you did.

One thing that at a glance I’m having trouble with is the multiple slopes of the curve. With these paritcular needles having only one conical length, shouldn’t it just be a straight (ish) line once onto the taper and until it hits the main jet ceiling?

+1 on that. For the double slope you are right, my bad. I was playing with the calc sheet and added a middle-step to check 1/4 opening …I had 0%, 10%, 25%, 30% so progression calc was not linear, hence the step. Here below how it looks corrected. Once we are confident with the math, we can drag the formula and calculate at 1% increments so it will look more like a curve than a step line

I think those softwares pretty much convert this surface area calculation into an A/F ratio based on fuel/air density and velocity. Throw in a couple of base settings and few adjustment logics based on input parameters and you have the inner workings of them figured out.