Mychron 5 data for noobs

Yes you have to select it, it’s along the top to the left.

To overlay on the map is a bit convoluted, you need to select your laps and export them, then open that file in google earth (you need to download it not open in the web browser). I’ll post you a step by step for that after diving, I don’t have my laptop just now.

2 Likes

Looking forward to this. Thanks for taking the time…

1 Like

Here you go

4 Likes

But with Racestudio 3, isn`t this process a lot easier now ?

Sort of. They now have it as an option while looking at the data analysis page compared to having to use Google Earth before. It’s really only good for a quick reference. Using Google Earth appears to be more accurate. But I’m finding RS3 is very buggy. I can’t even get split times to work on RS3 right now, let alone writing custom Math Channels or use a number of other features that were in RS2.

I didn’t try 3, sounds like better to stick with 2 until they sort the bugs out

+1 on what James said.
Sometimes you just have to bite the bullet and RTFM!
(that’s Read The F***ing Manual)
I just got onto the Micron/RaceStudio3 learning curve too. It’s not too bad. Download the PDF files from the links above. Read through them a few times, it eventually sinks in and makes sense. I suggest setting up your Micron to access your home router, and not as an Access Point (default), that way it’s more secure, and you can still use your computer’s internet connection. In Access Point mode, you’re computer is connected to the Micron only, or your internet connection, not both. Of course, if you’re at the track and don’t have WIFI, you kinda have to use AP mode. But you can password protect it. It’s a sophisticated piece of equipment, as is the RaceStudio3 software, so there’s going to be a learning curve. Ride it!

I did it! I brought my computer and downloaded my data. Now I just need to figure out how to use it… would anyone be down to FaceTime with me someday and show me how it works? (I’ll pay you) I don’t know what to do with the data. Like, how to make it useful. I got gps tracking and rpm tracking to work but idk what to do with the information

Here’s some info in the interim that should help.

So Ive got a 3 second lap time, and when I try and fit the graph to best proportions it does it for my 3 second lap time… how do I fix that? can I delete that lap?

Edit - solved. sort of
this will be my questions spot
How do I change the color of one graph line so I can easily tell the difference between the two?
Whats the most useful form of data?
How do I apply this information to my driving?
How do I make the colors of the racing line different on the gps map so I can compare them? I did it before But I dont know how
Thanks!


1 Like

Elias,
What you should do is start with Davin and AIM’s series. It will really help.

One thing to note is that if you only have access to your own data, then you’re utility from that data is only as good as your memory recall of the individual sessions, and what you may have done differently in terms of setup and/or driving. In other words, say you changed your approach to turn 3 (just for instance) and gained 0.3"…if that shows up in the data but you’re not able to recall what caused the gain vs. your other laps then it’s a moot point.

Data is all about context, and will be most useful when compared across a number of drivers who are then able to discuss differences in technique.

Lastly, in order for the data to be useful in any context it’s important that the driver is able to put in consistent laps. Without consistency behind the wheel the data is borderline useless.

2 Likes

Data shows you (with very high precision) what you are doing, and the results your actions are producing. However, it does not really reveal opportunities for improvement until, to @Muskabeatz’s point, you compare a piece of data to something (your best lap, or preferably the lap of a faster driver).

But, discovering ‘what’ can be improved is just the beginning. Once you know ‘what’, then you need to figure out ‘why’ before you can figure out ‘how’ to fix it. For example, let’s say the data reveals that a slower driver is driving a different line through a critical turn than the ‘fast’ guy being used for comparison. There could be many reasons why a driver might be driving the ‘wrong’ line:

  • Lack of knowledge; e.g. don’t know what the right line is (likely for a new guy)
  • Incorrect objective/goals; e.g. prioritizing entry speed over exit speed
  • Incorrect interpretation of the experience/feeling; e.g. their vision/feel is telling them they are in a different position on the track than they really are… they ‘think’ they are actually driving the same line as the ‘fast’ guy.
  • External/equipment limitation; e.g. know what to do, but can’t physically do it a max speed with the current chassis setup (or tire condition, or track condition, or ?).
  • Etc…

The ‘fix’ depends on the ‘why’; for example, you educate the new guy, or you adjust the driver’s goals/priorities, or you use the data to show the driver they need to adjust their interpretation of where they are on track, or you tweak the kart setup (maybe based on the fast guy’s setup).

One last thing to be wary of is getting yourself in a tail-chasing loop with data (especially when comparing to your own data), because conditions are always changing. For example, it may be impossible to get near your ‘best lap’ if the track is dirty, colder, etc. Likewise, the optimal line may shift, for example as rubber gets laid down throughout the weekend.

1 Like

All good points. I will try and do my best to remember when I do something differently so I can see how it changes things in the data.
For reference, My best lap was the lap where I passed #23 in my most recent video

Taking notes is a big help for this. Whether it’s writing them down on paper or typing them into the comment box when downloading the data. You’re simply not going to remember the details if you’re trying to look at data days later.

2 Likes

Ooh didn’t think of that. I’ll create a document for that

1 Like

You can overlay in the web version google earth.
Open a new project, import the kml file, and then it is done.

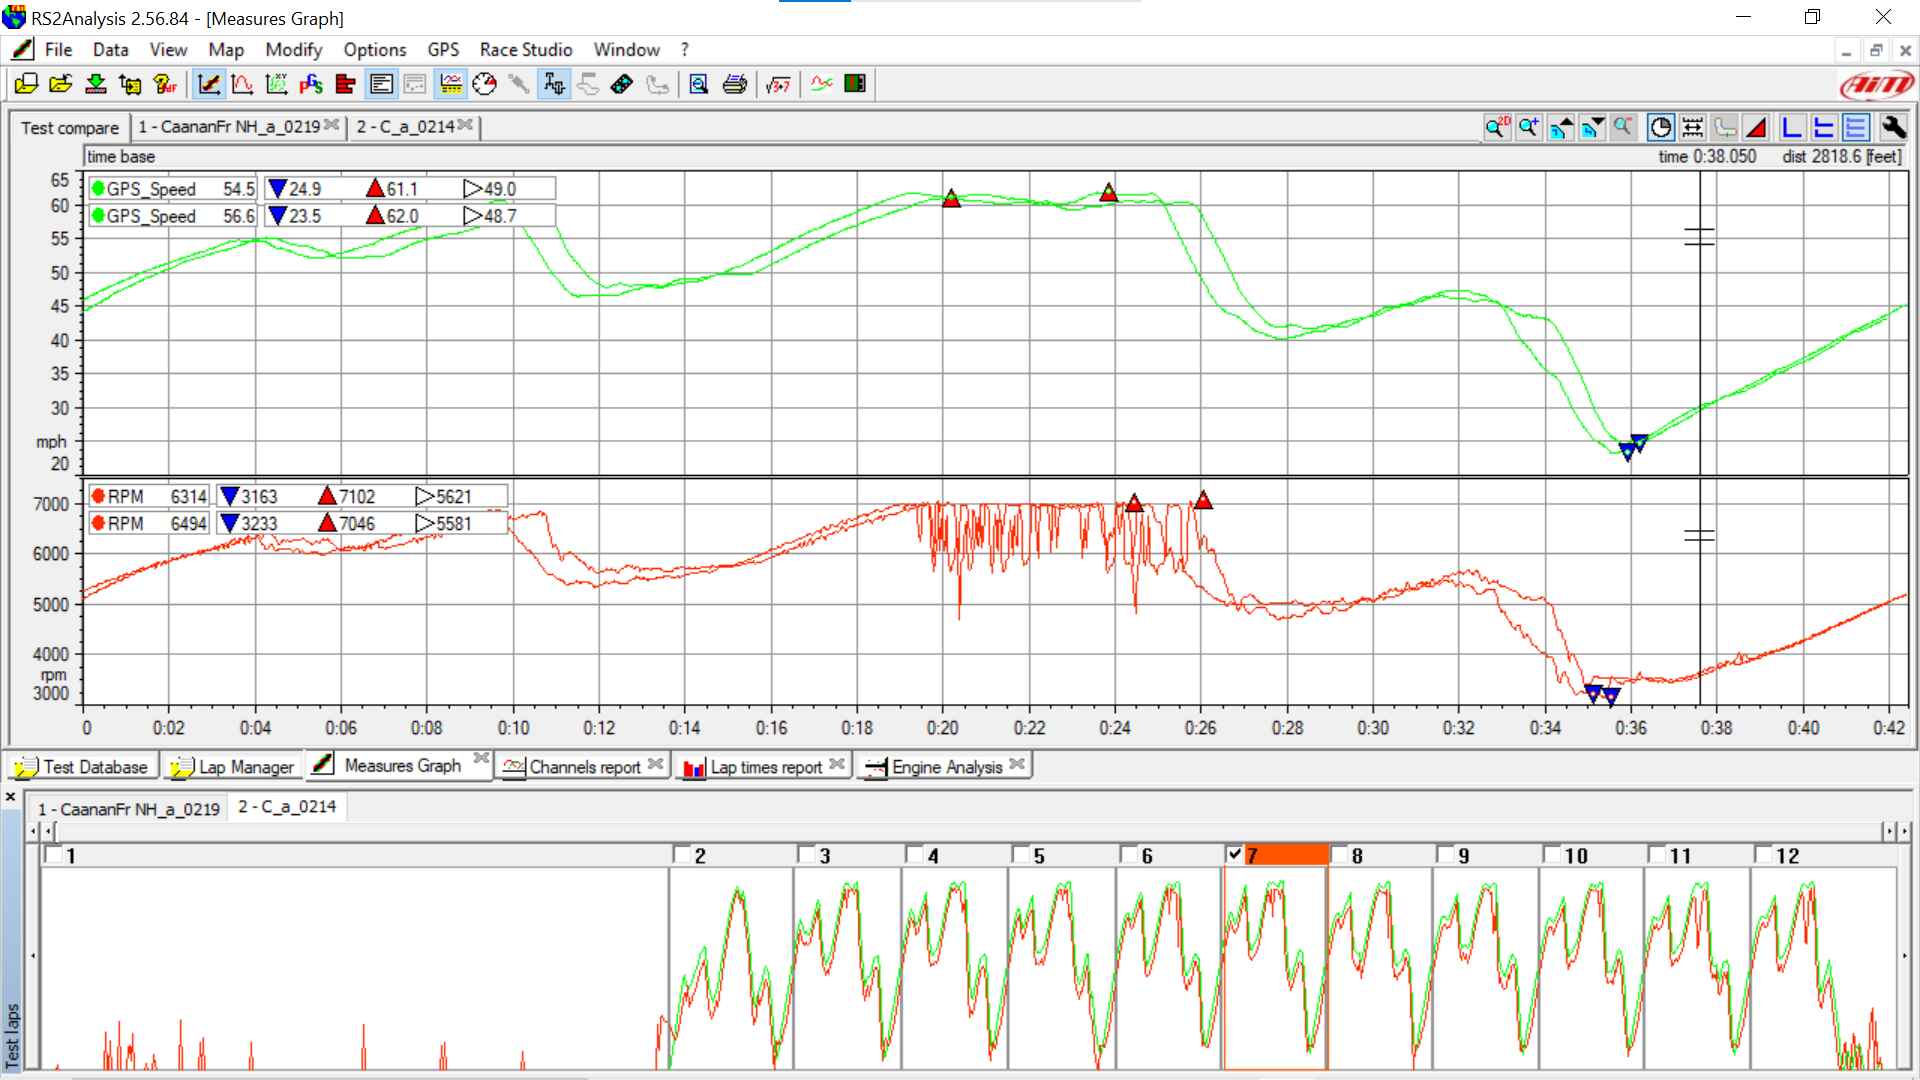
I would keep it simple to start. Uncheck the first few laps of the session, as your tires are cold and the data will not compare well. On your measures graphs, select GPS Speed and RPM. The default is to display your fastest lap. It will be checked at the bottom of the screen. When choosing a lap to compare it to, look at the lap list and find a group of laps that have a similar lap time, but slower than your fastest lap. Chose one. Now back to the graphs. Toggle between distance and time, you want to compare using distance on the speed and rpm, the time bar will appear at the bottom between your measures and laps when you select another lap. In the time bar, you will see where you gained or lost time. The graphs are in sync with each other, so you can look on the measures and see what you did. Did your slower lap have you brake earlier and get back on throttle later or what ever. You can see where the graphs rise and fall compared to each other. How sharply the rise and fall and for how long. You can compare that point on the graphs to your position on track. Where were you in the turn? Best to focus on areas where you lost or gained time. Try to see what you did differently. Since most time is lost in the braking phase, note what is happening during that period.

Using the speed trace:

Where did you begin braking (where the graph starts to drop)? Did you slow down sooner or later into the corner? Could you have pushed the braking zone deeper into the corner?

Were your braking at maximum force (how sharply the graph drops)? From beginning of braking to the end, you want to see a relatively straight line. The steeper the line, the harder you are braking. If you see a wavy section in the braking measure, you are not holding the brakes at a constant pressure. This could be for many reasons from situation on track to making corrections. You have to know what’s happening on track to know the difference, but ideally you want a straight braking slope in your graph.

Were you carrying the brakes to long (how long of a distance does the graph drop), before the curve starts going back up? If you are holding brakes for too long, you could potentially pick up some time by shortening your braking zone.

Using the RPM trace:

Where did you pick up the throttle? Assuming you are not using both pedals at the same time, at what point does the RPM measure start to go up? Are you gaining or losing time if you pick up the throttle sooner than later?

What is your peak RPM and your lowest RPM? You may benefit from a gear change or is your driving causing the revs to drop too much and take you that much longer to get back up to speed?

Are you bouncing off the rev limiter for a long period of time? Are you slow off the corners? If your laps are pretty consistent, then you can use this to figure out which direction to go if a change in gearing will benefit you. You may gain more time by staying on the limiter longer to compensate for the tight sections or you may find dropping teeth makes you quicker.

Is drafting involved? Do you regularly have someone to draft with or do you find yourself running solo? This again is where you need to be aware of what is happening on track to know what to do with it.

This is just some basic stuff to get you started with analysis.

8 Likes

Had an after thought about this thread. AIM has a video accessory called Smarty Cam. It automatically syncs the data with video, so you know exactly what is happening on track and the data overlaid on the video to know what you are doing. It sounds great and it is. However, they want close to a grand American for the setup. As an alternative, I found RaceRender. It’s a program that performs essentially the same function, only you have to sync the data to the video. There is a trial version (which I used to decide if it was right for me) to test out the software. I decided the extra step of syncing was worth the savings. Here is an example of what it looks like. Please keep in mind, this was early in my Karting experience, but paid off in what was happening on on-track to make the most sense of my data. I am running a Mychon 4 with GPS that includes accelerometers.

Warren (kart 63) is an older Gentleman Racer and was getting tired toward the half way point in the race. At the time I didn’t realize he had pulled off track right after I passed him on lap 8. Good Show Old Boy! In case you can’t tell, I am in a 125 Tag Kart (single gear) with everyone else in a DD2 (two speed) Shifter!