Disclaimer: This is just the rambling of a man who needs to chart and model things to wrap his head around them. Please do not take anything I say and apply it as fact to jetting, ignition, or squish, etc.. And most importantly do not take a die grinder to your $7k engine.
Assumption 1: These engine designers know what they are doing so any major changes are not going to benefit us. We are looking at understanding why they did what they did. Maybe we take a stock casting and make it conform to the designer’s intent.
Assumption 2: Driving is 90% of performance. The engine and chassis are the remaining 10%. Regardless of what the Dad’s say in the pits, you’re probably not getting beat because little Jimmy has a hot engine. (Just look at Max Verstappen dragging the Red Bull to the front while everyone else in the second seat fails miserably)
Goal: I’m too cheap to buy a well know $400 piece of engine simulation software that will do alot of this work for me. I want to be smart enough on these engines that my bullshit meter is strong enough to know when someone is making things up. This forum is full of really smart people that can probably help me sort out any misunderstandings along the way. I essentially want to be able to make simple physical changes like cylinder height, squish gap, and ignition timing at the shop or track and really understand why those have an effect. Because the group here as a whole has helped me out a ton already, I’m willing the share any spreadsheets we generate once I know the information/calculations are correct.
Last long winded point: While I’m a pretty open book, I have been told some tuning tips in confidence and cannot share those unless I’ve seen it stated publicly somewhere. There are some forum lurkers here that have shared info with me IRL and they probably don’t want me sharing said info.
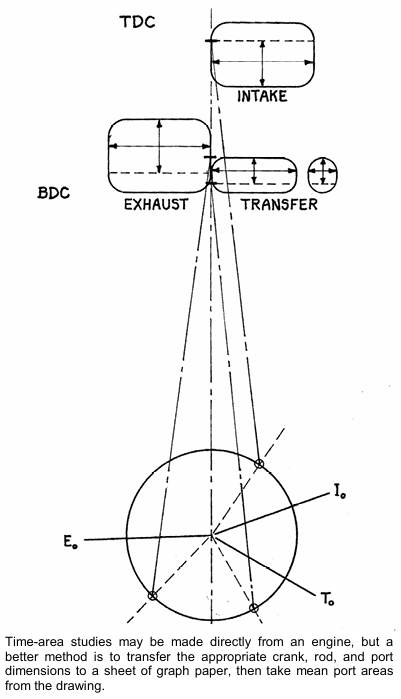
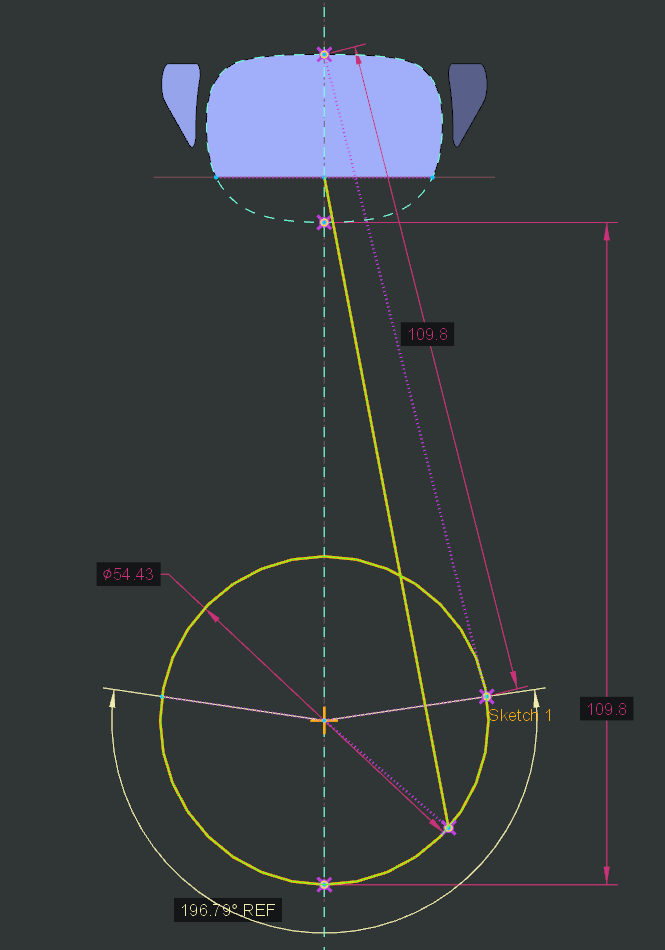
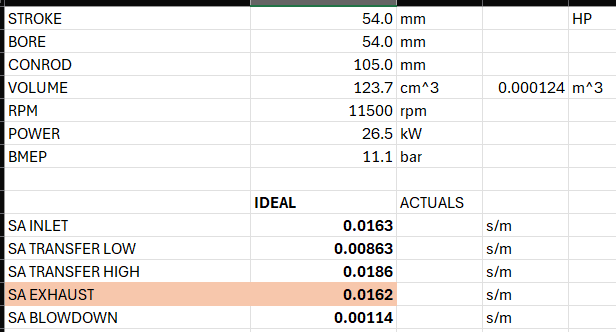
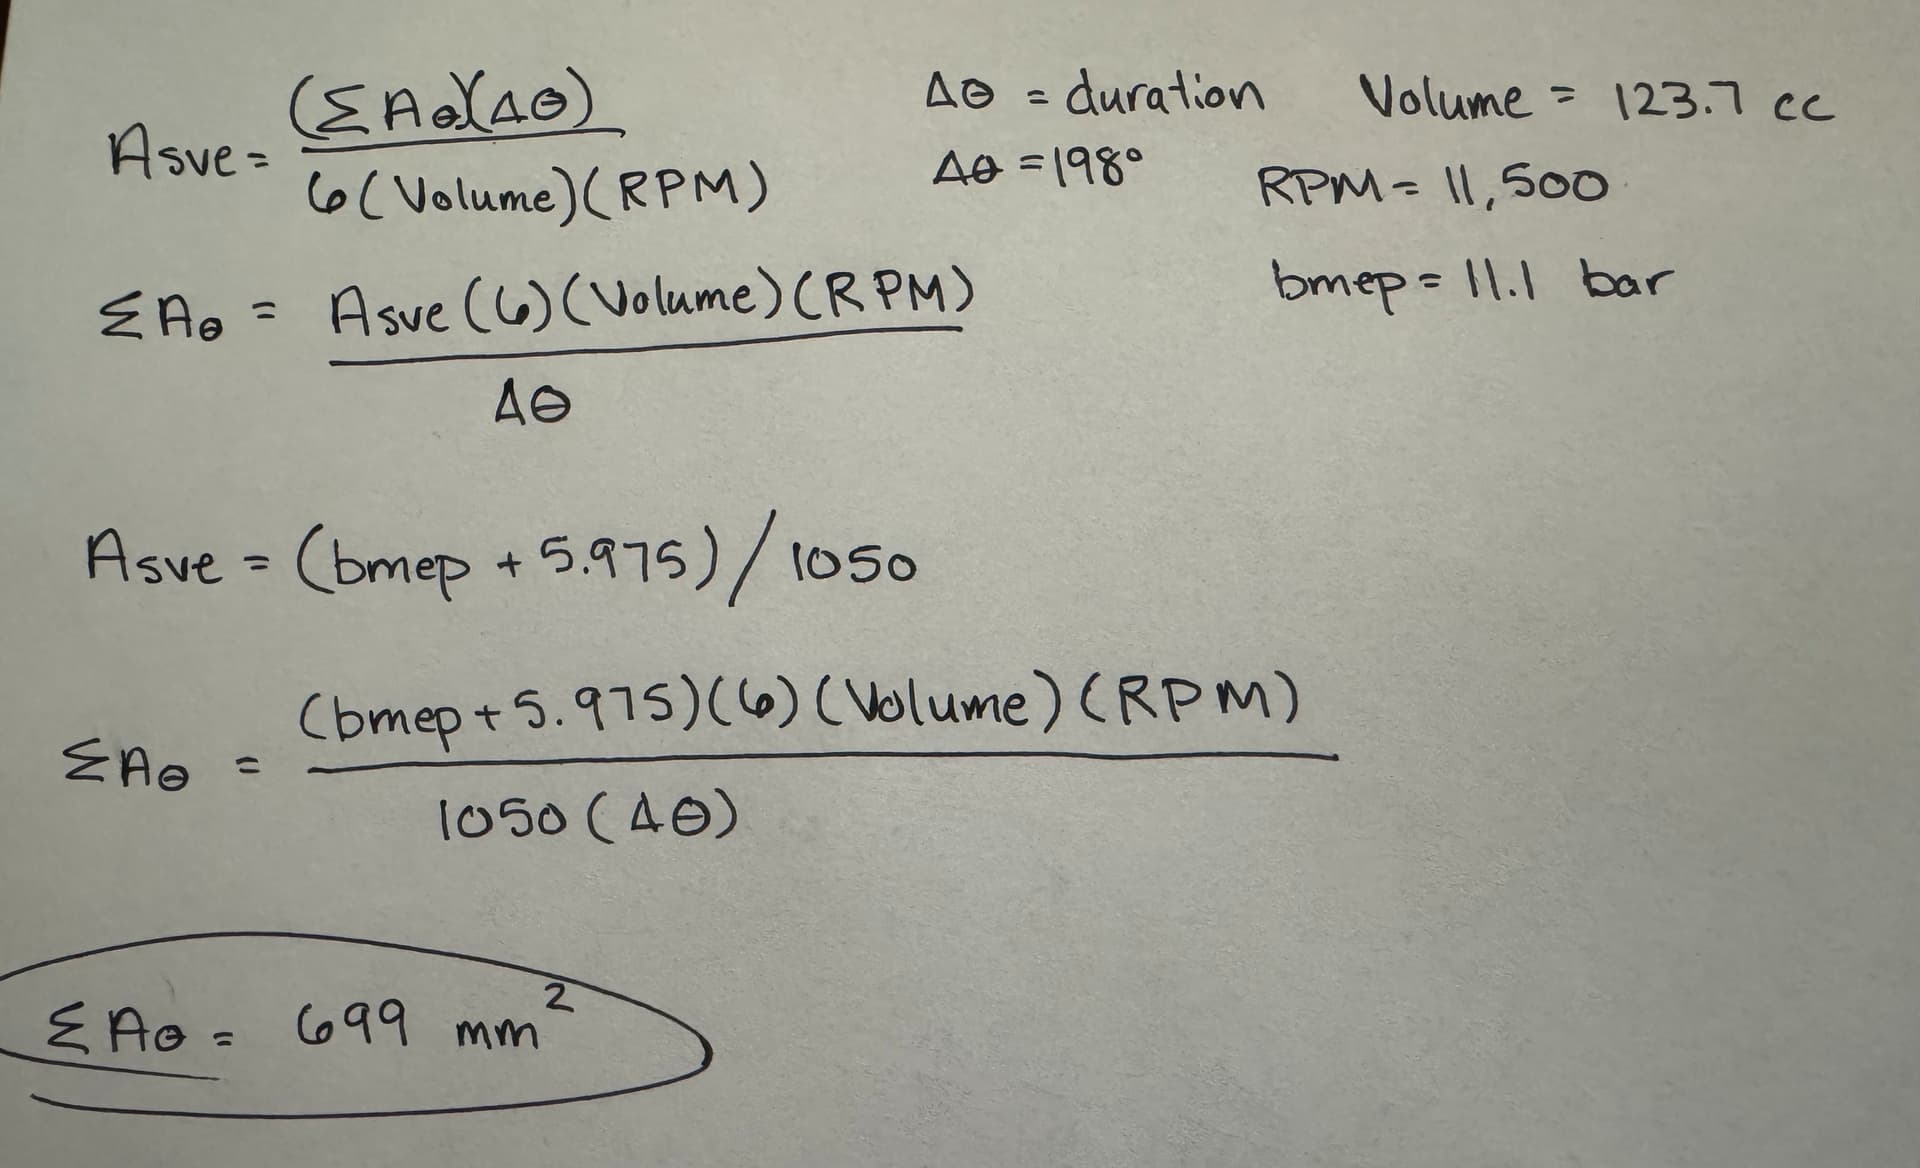
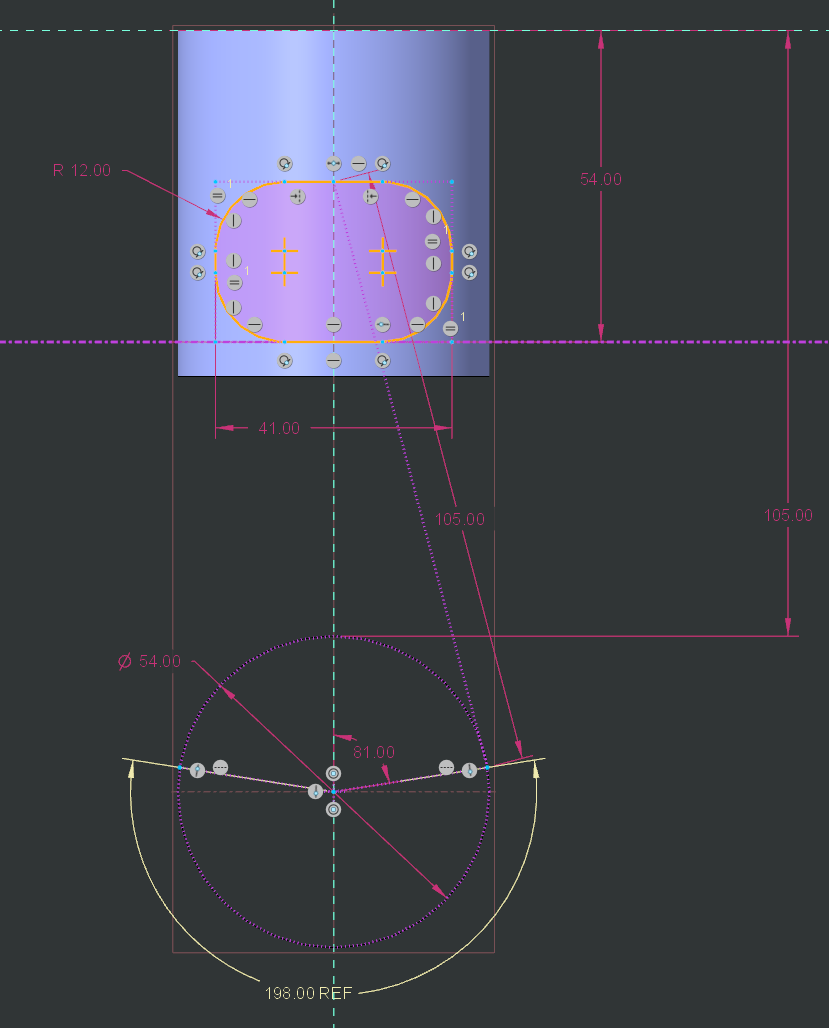
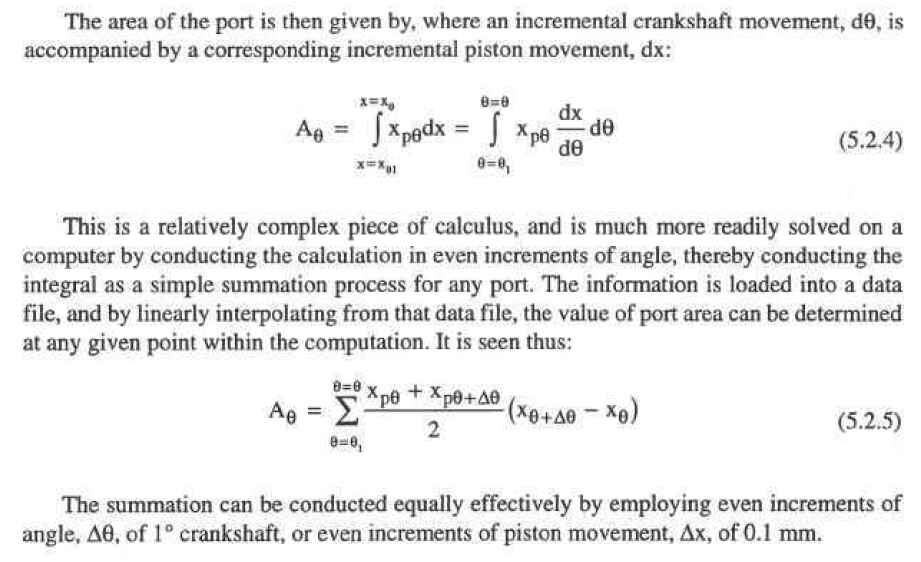
Step 1: Establish a simple 2D port map and 3D cylinder model from the homologation documents. Main goal here is to find BDC, TDC, and the port duration/area for the exhaust and transfers. We want to know when these open and close. We will take these findings and punch them into an excel sheet.
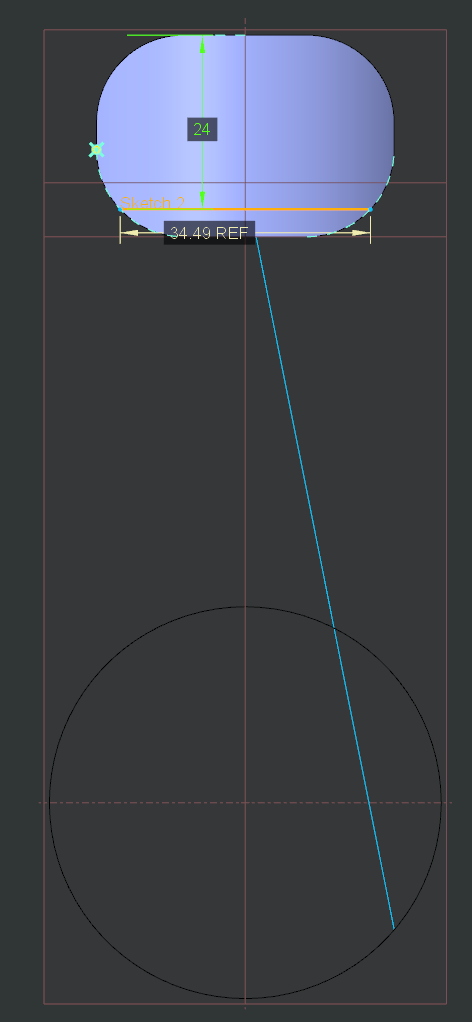
Taking the flat port map provided and rolling that back into a cylindrical shape got me really close on everything except for the exhaust boosters. I may tweak the shapes and locations a tiny bit to find a happy medium between the two images. For now it’s close enough to look at crunching numbers. (You can only scale and interpret a fuzzy image off a PDF so far)
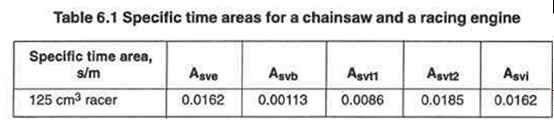
I found a book from the 70s that appears to be the whole grail at the time. Two-Stroke Tuners Handbook by Gordon Jennings. This book looked at mean time-areas to see where the engine lies in terms of performance. We will replicate the paper port-mapping in CAD to determine these areas and calculate our mean-area times.
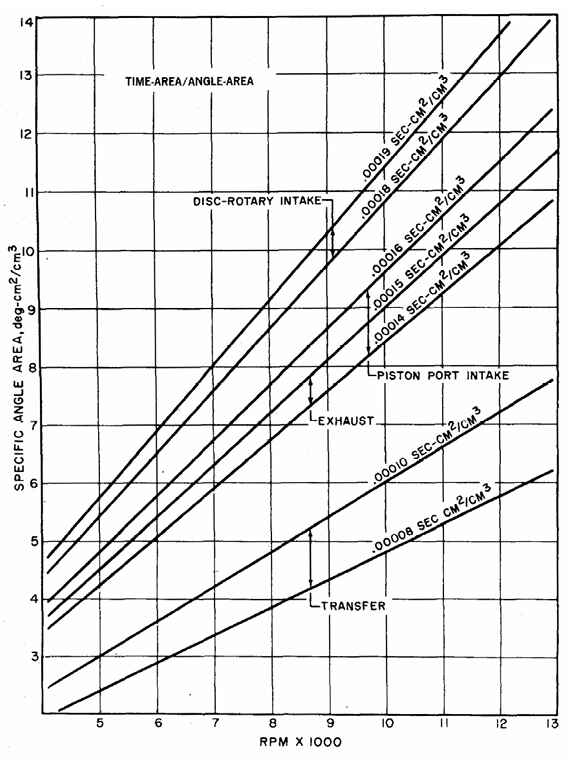
I found these numbers and they are pushing or far outside what was considered the limits at the time…. Obviously the engines are pumping out serious power and working, so I’ve move from this to a more modern method of looking a time-areas. This next step is where I’m getting slightly stuck matching the math to examples provided and I might need some help.
Before I get yelled at I know I’m sort of looking at this backwards as the tuned pipe is the heart of the engines performance I just haven’t got there yet on modeling/math.
This is a perfect reference! I probably won’t need to take what I’m doing as far, just depends how bored I get with my self imposed probation from turning laps while I wait on our kiddo to be born.
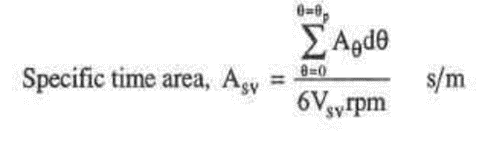
This is where I’m stuck and will have to do a better write-up tonight. Essentially I cannot get my numbers of the Specific Time Area Summations to agree with the book example. I have backed out the solution and know what it needs to be, but I’m missing a step or something obvious. Nothing I do in Excel or CAD gets me to the magic bullet of 699mm^2.
I am working off a more modern take on calculating time-areas from Design and Simulation of Two-Stroke Engines by Gordon Blair from 1996, which looking at other software everyone else seems to base their mathematical models off as well. So if I can crack this I’ll be quite happy and can get proper models.
I saw that you mentioned that you’d like to know how to “make simple physical changes like cylinder height, squish gap, and ignition timing at the shop or track and really understand why those have an effect”.
To clarify, do you also have other IRL goals/projects aspirations (e.g., shaping your own cylinders/ports/heads), or is it the case that you’re grappling with the modeling and the numbers, on a theory-only basis, as a way of ‘just trying to understand it all’? (but aren’t intending to start machining anything yourself in the near future)
Mostly understand with the ability to do subtle changes. My local track is pretty small so I’d like to take an engine and say make some physical tweaks to suit the bottom end power band. Versus going to K1 Circuit where I can stretch the legs a bit more and maybe by just altering squish/timing gain some top end. I think I already know how to do this, but “hard” numbers would be nice.
With all the new homologations coming out I’d like to be able to plug in the numbers from different engines and get a ballpark feel for how each should perform in theory.
Weird - that’s exactly the scenario I was in when I jumped down the rabbit hole of trying to solve this very issue by swapping ignition coils/maps after trying most of the less drastic options. Ultimately, I ended up never being able to impact things as much as I would like because all of these kart engines are designed to do well on mid/top end tracks (aka like the majority of European tracks and the national-level tracks in the US), and with regulations being what they are there isn’t enough adjustability in the platforms to truly change the bias. (for instance, a fully adjustable ignition map could do the job)
None of that is to say that the performance can’t made a bit better than it would be otherwise on even the tightest track, just that you’re swimming upstream with something which was fundamentally built for stretching its legs. But at least you have the gearbox. I’ve kind of been lamenting my decision to not go the gearbox route the last time I choose a new engine package.
I’ve only driven 4 R2s and it wasn’t exactly back to back, but they really did come on power differently enough. I certainly would have taken one over the other depending where I was racing.
Absolutely. I’ve done everything I can with what I have too, and it’s definitely worth the effort versus doing nothing. That said the situation of ‘the track is just a tight track’ is so extreme that even with doing all that can be done the lap record I’m aware of for KA100 is actually below the TAG class track record, and that includes TAG packages driven by podium class national drivers. The fact of the matter is that the KA was just made with exceptional low end for it’s displacement relative to that of the TAG engine and on tracks this tight that counts for more than one can tune around.
Where I’m stuck and has me dusting off my old calculus books to figure out what I’m doing wrong.
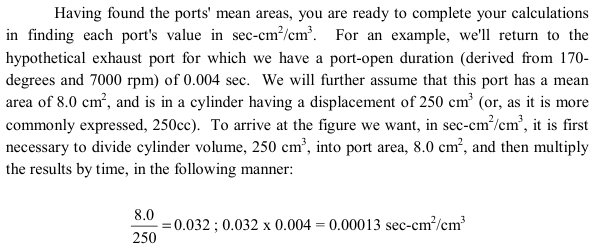
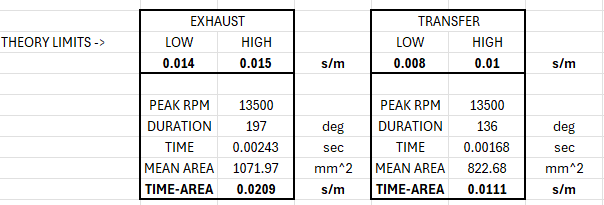
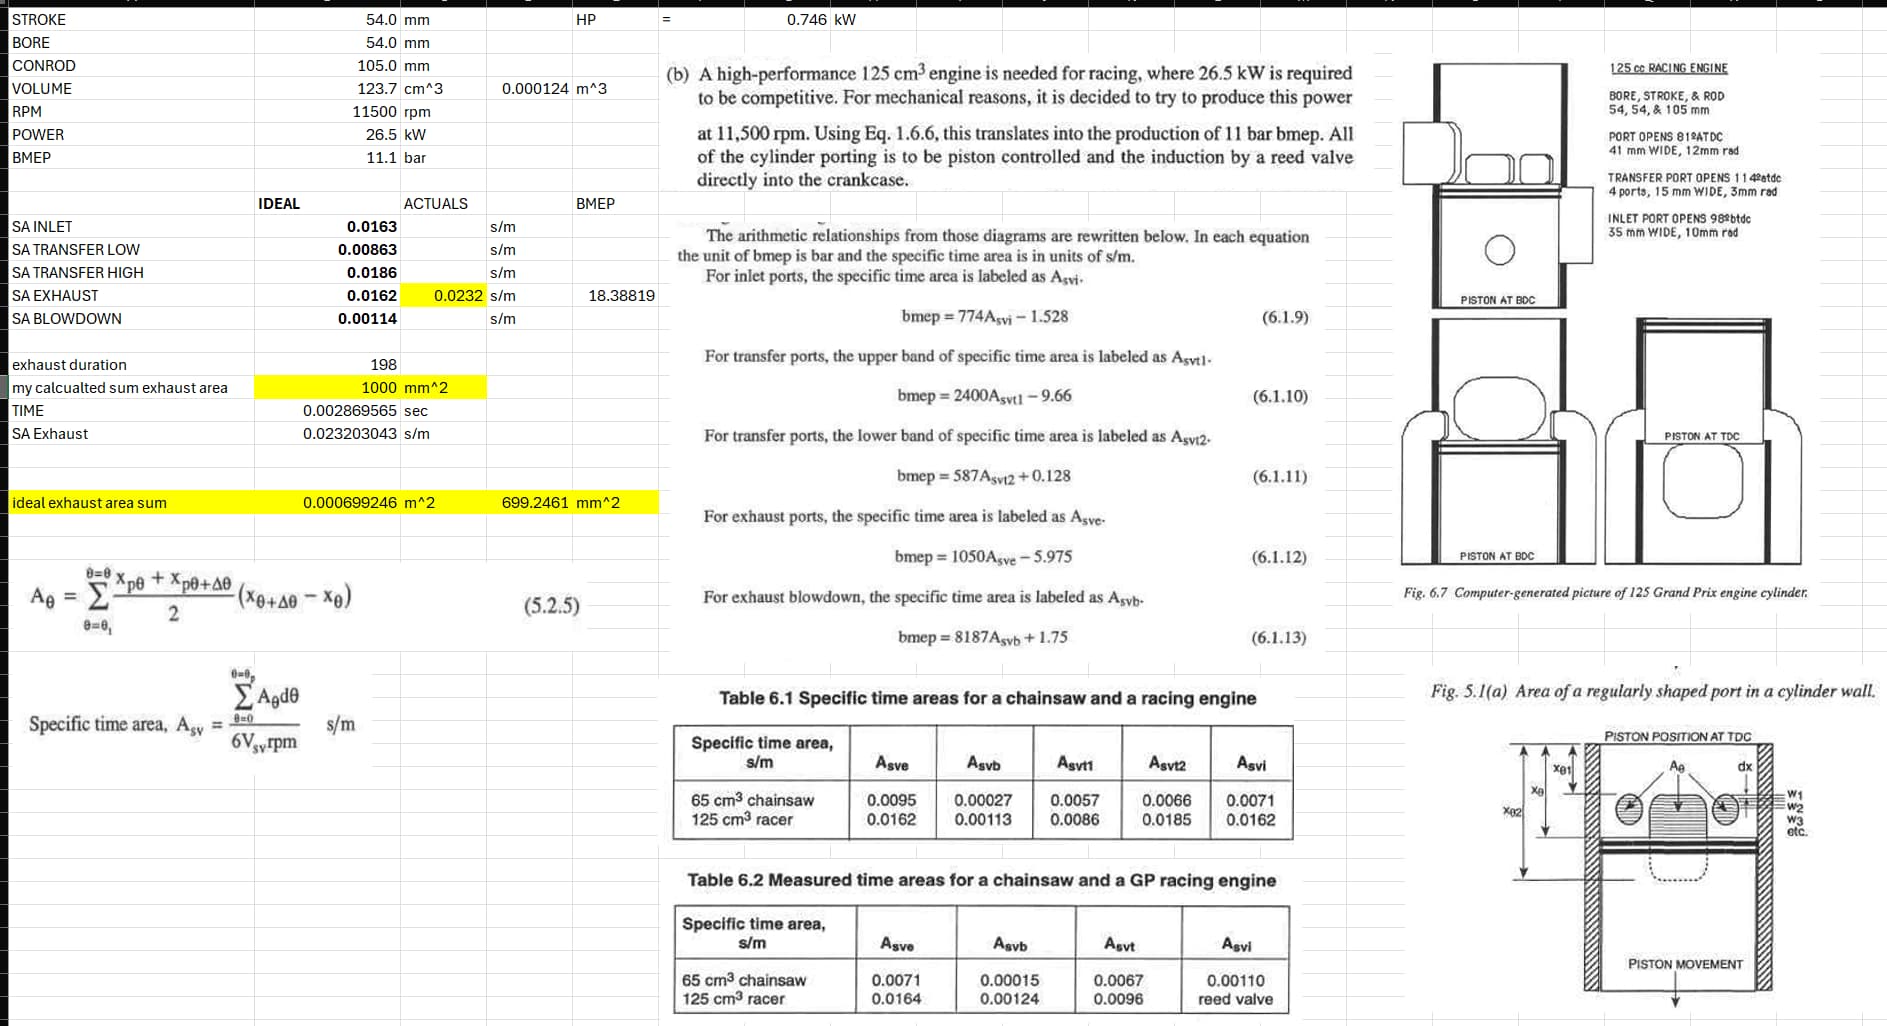
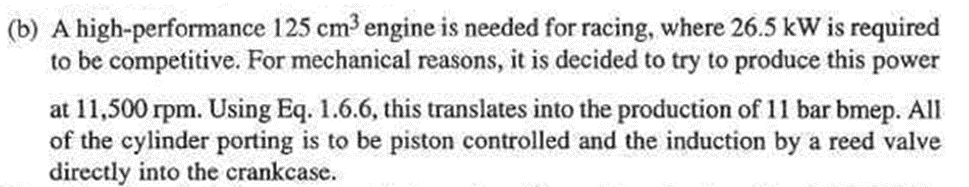
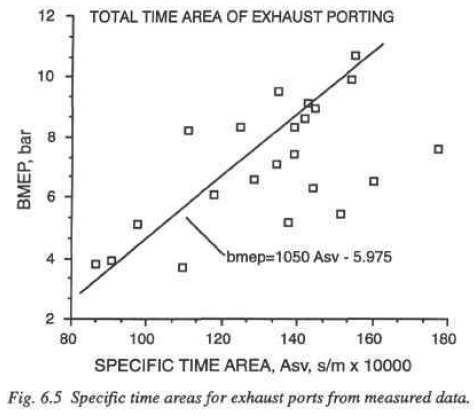
The book presents an 125cc engine to be analyzed. The Author has dyno’d a bunch of engines and found a best fit linear relation between areas and power. Let’s just focus on Exhaust to start, as you will see below it’s a simple square with rounded edges.
So this is easy. You take what is given and find the area’s based off the equations above solving for areas. You don’t need to know anything else about the engine besides is power output is 11.1 bmep. This is a super simple y=mx+b. I can get these right.
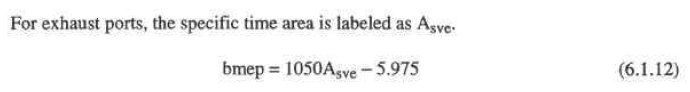
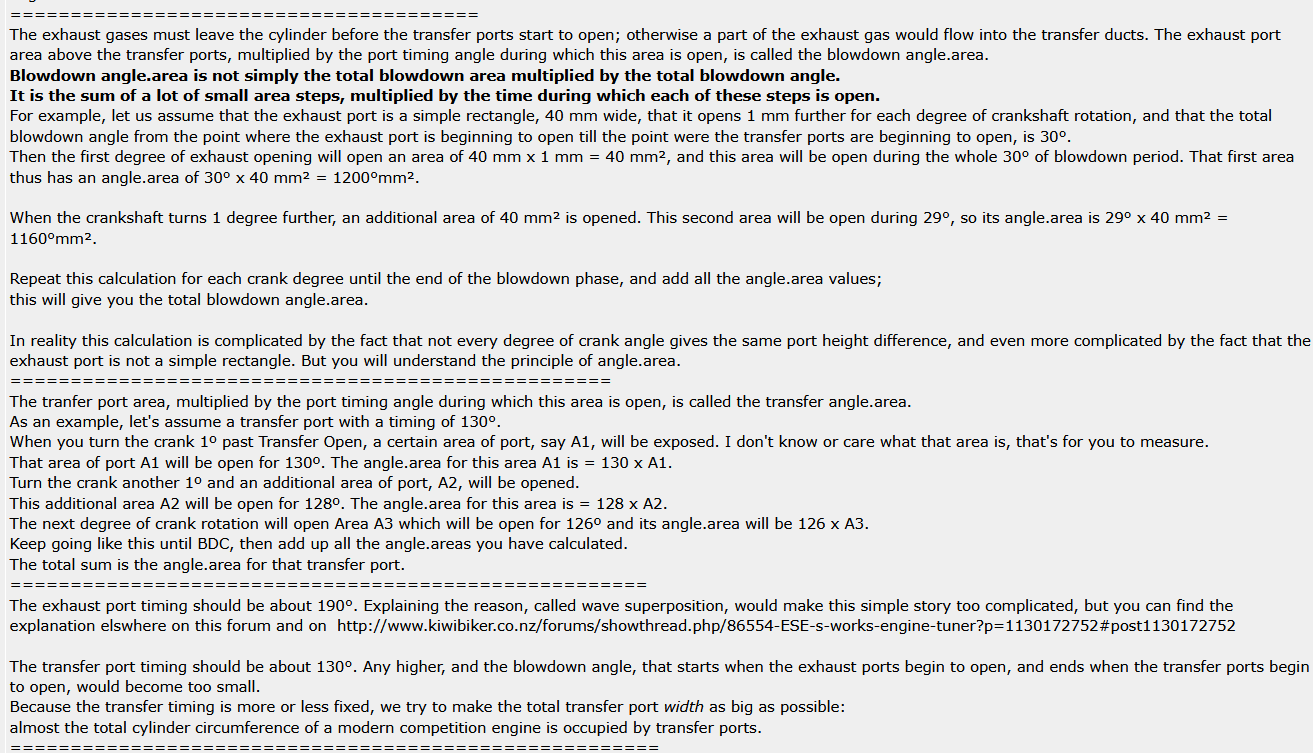
What is kicking my butt is solving for these Areas using the “physical” model to get the actuals reported out. What I need to find is the specific time area for the exhaust port using the equation below.
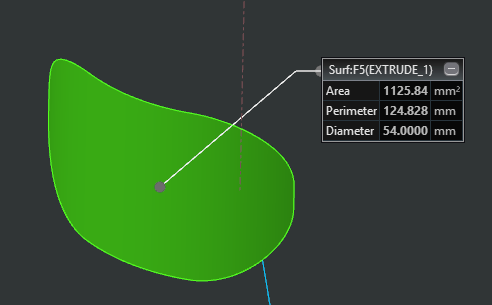
But modeling the cylinder and finding area’s I cannot come up with the 699m^2. We a formula/method for establishing this area as it will tell us alot about the KZ engines we want to analysis.
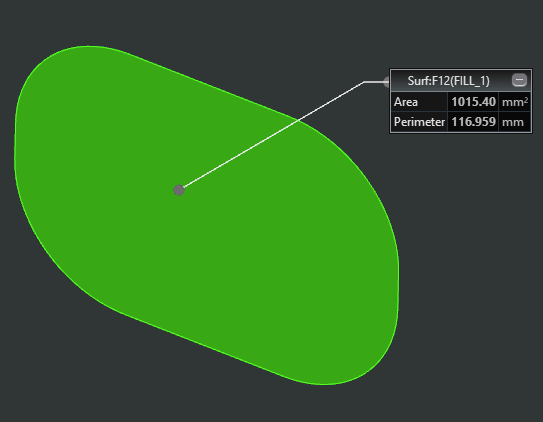
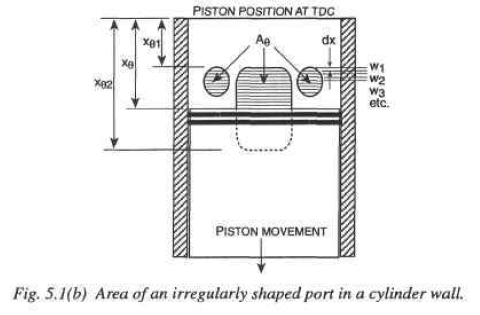
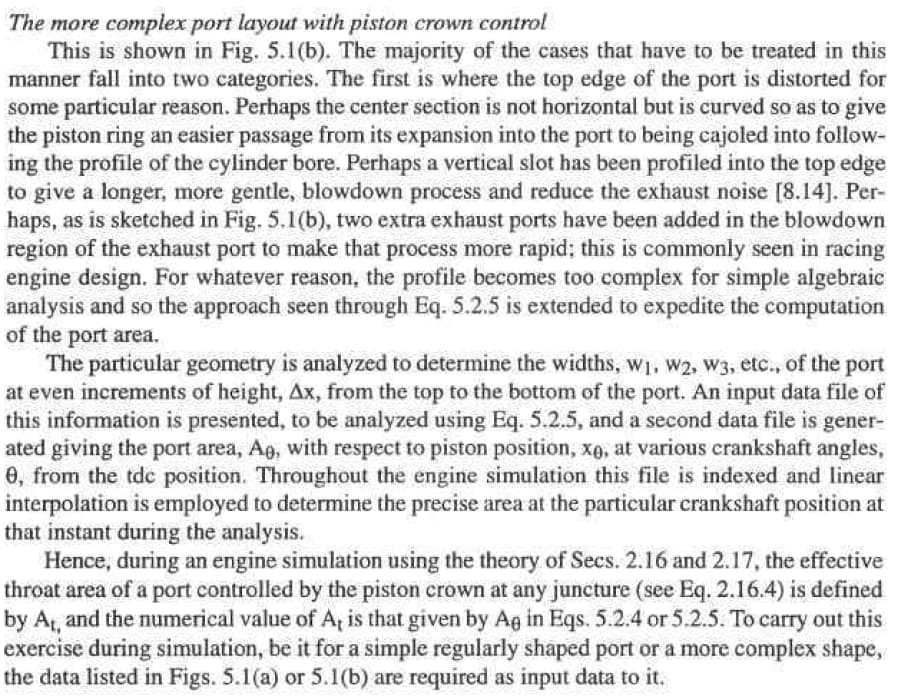
So I roll back a couple chapters and look at where they talk about calculating port areas. I think I’m doing this right, but it’s just leading me right back to ~1000mm^2 which my CAD software is already reporting out as it’s the total area of the port….
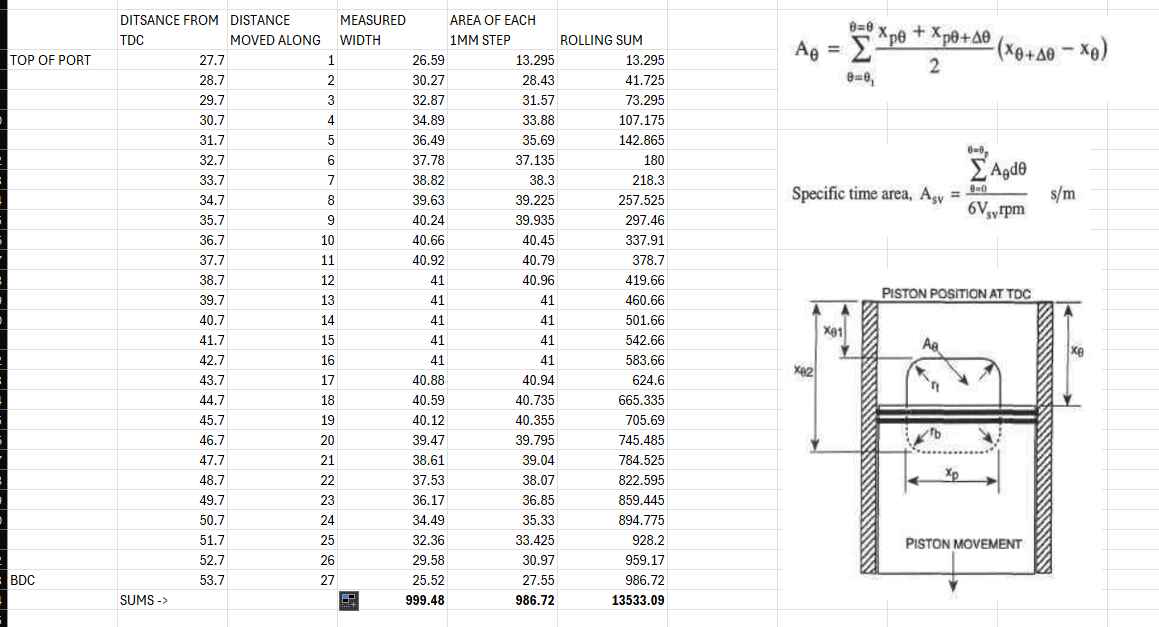
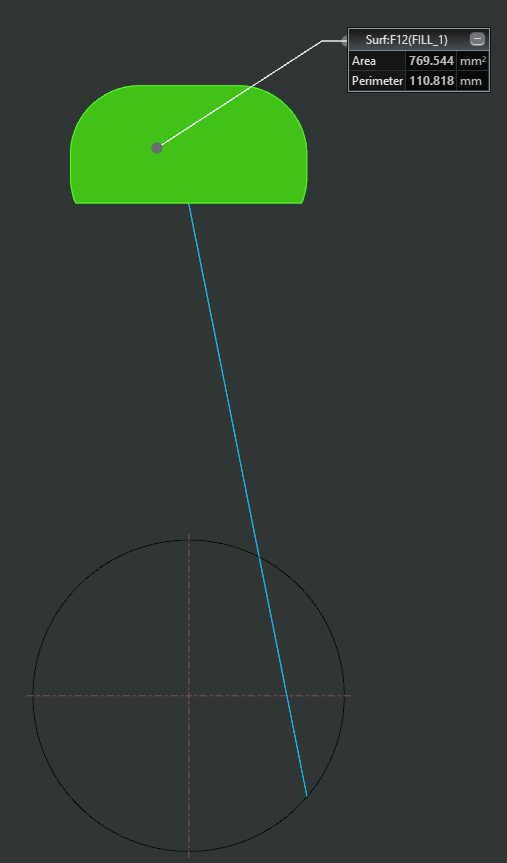
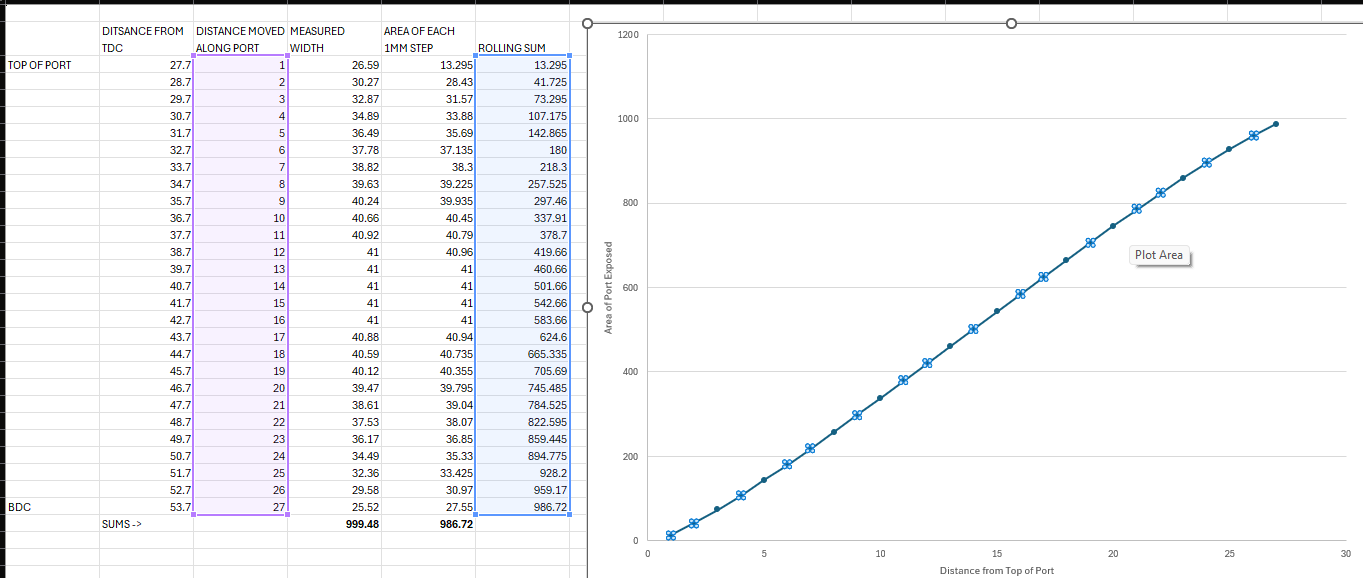
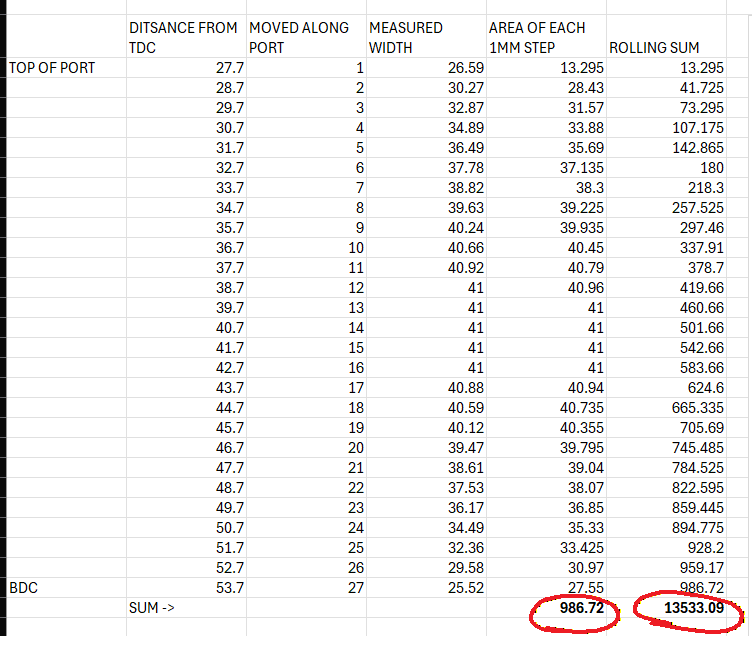
So what am I missing here? There is a step or formula looking me right in the face and I’m just not seeing it. My next thought is plotting the area exposed with each 1mm step of the piston onto a chart and finding the area under the curve?
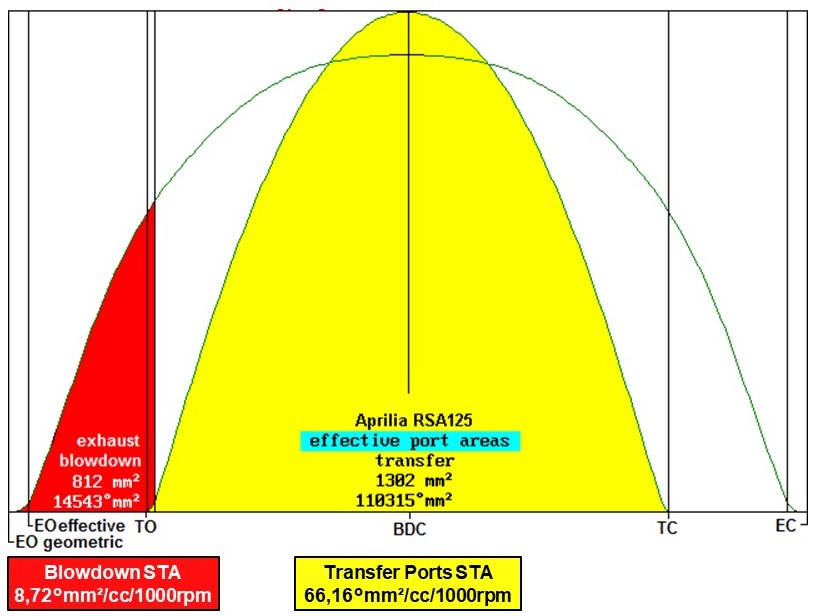
From James’ post above on the Aprilla 125cc engine, I think area under the curve is the answer I’m after. If the Aprilla has an area of 1302 mm^2 and 110315 deg-mm^2, I’m getting 1000mm^2 and 13533 of what must be deg-mm^2?
OMG as I type this it hit me…. I bet if I take the 13533 number I found and divide by duration of 198* is gonna be darn close to 699mm^2.
So I found the magic number last night using the above method. Even more tedious than what I was doing. I have to convert each step of 1mm to angular degrees of crankshaft movement. Not bad once you get the math figured out. I had already done that for an ignition curve graph I’ll show later on. I’m going to pause on the areas. I’ll circle back once I write some code in MatLab to do this for me.
End goal is to look at a port map and spit out some numbers for any KZ engine. Taking 1* steps or sub 1mm steps by hand and measuring is far too time consuming.
I’ll be looking at the exhaust lengths and areas next. Much quicker and easier math to do in Excel.
True, the local Sprint track is pretty tight for finding those kind of things out. But if you want to “stretch the legs” so to speak we have straights more suitable for that kind of research! Maybe after your current adventure becomes a little more settled. 2026 SWK Race Schedule
January 18th - Firebird West track
February 22nd - Podium Club
March 28th and 29th - Chuckwalla Valley Raceway
May 23rd and 24th - Inde Motorsports Ranch
September 5th and 6th - Inde Motorsports Ranch
October 11th - Firebird West track - One Hour Enduro
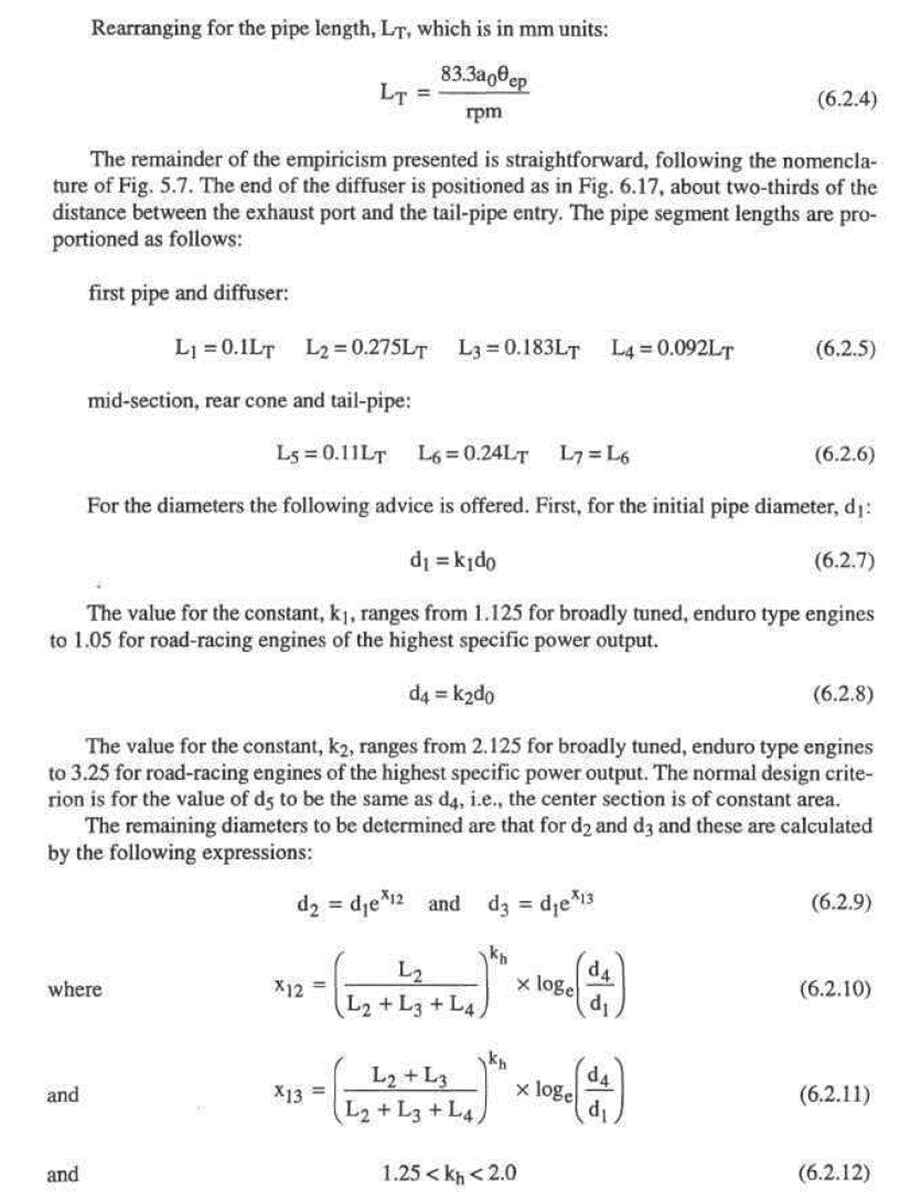
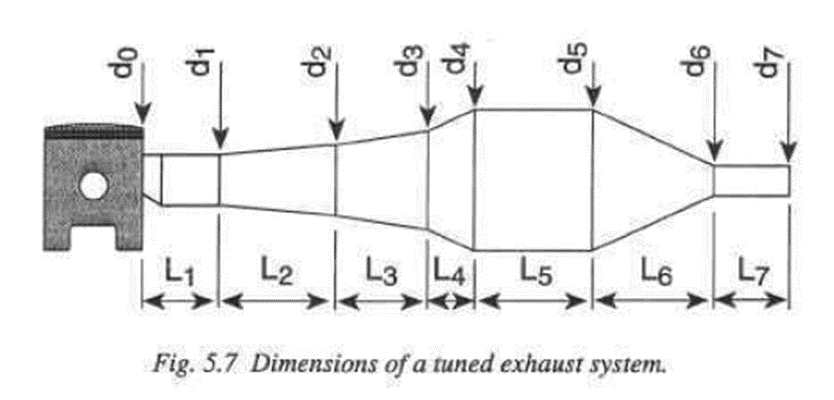
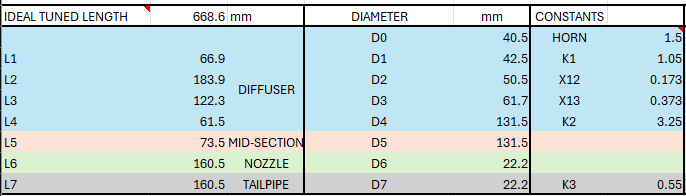
So we have some pretty easy math for calculating exhaust lengths and diameters. We have to make a couple assumptions on constants and coefficients to get our baseline. Then we will model the baseline homologation pipe and try and back out where in the RPM range and what exhaust temperature the manufacturer tuned the exhaust.
You punch in all of that, make some best guess assumptions for constants from the book guidelines, and come away with a starting point if you were building your own pipe. For two strokes there are four well defined zones. The diffuser cone, what I’m calling the straight mid-section, the nozzle cone, and the tailpipe.
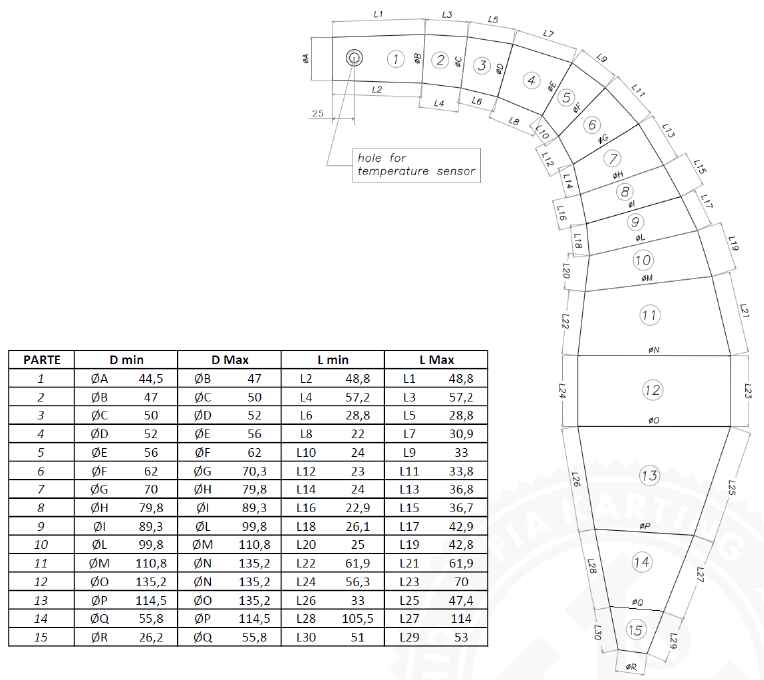
Lucky for us the homologation document spells out the different length and diameters the pipe should be. The tolerances are pretty loose for min and max dimensions. You can easily see how you could build two conforming pipes with vastly different internal volumes. Measuring a real production exhaust in the future will be very important. Anyways, next step will be to model the exhaust so we can get our theoretical centerline lengths and equivalent diameters.